

Solar & Renewables
Solar thermal data collection for owners, EPCs, and O&M teams. MIR captures RGB and radiometric thermal data across solar arrays — locating hot spots, bypass-diode failures, PID, and string outages down to the individual module.

Blue UAS Cleared
Freefly Astro aircraft listed within the Blue UAS framework for procurement-sensitive missions.

$5M Aviation Liability
Coverage built for infrastructure field operations.
Redundant Aircraft
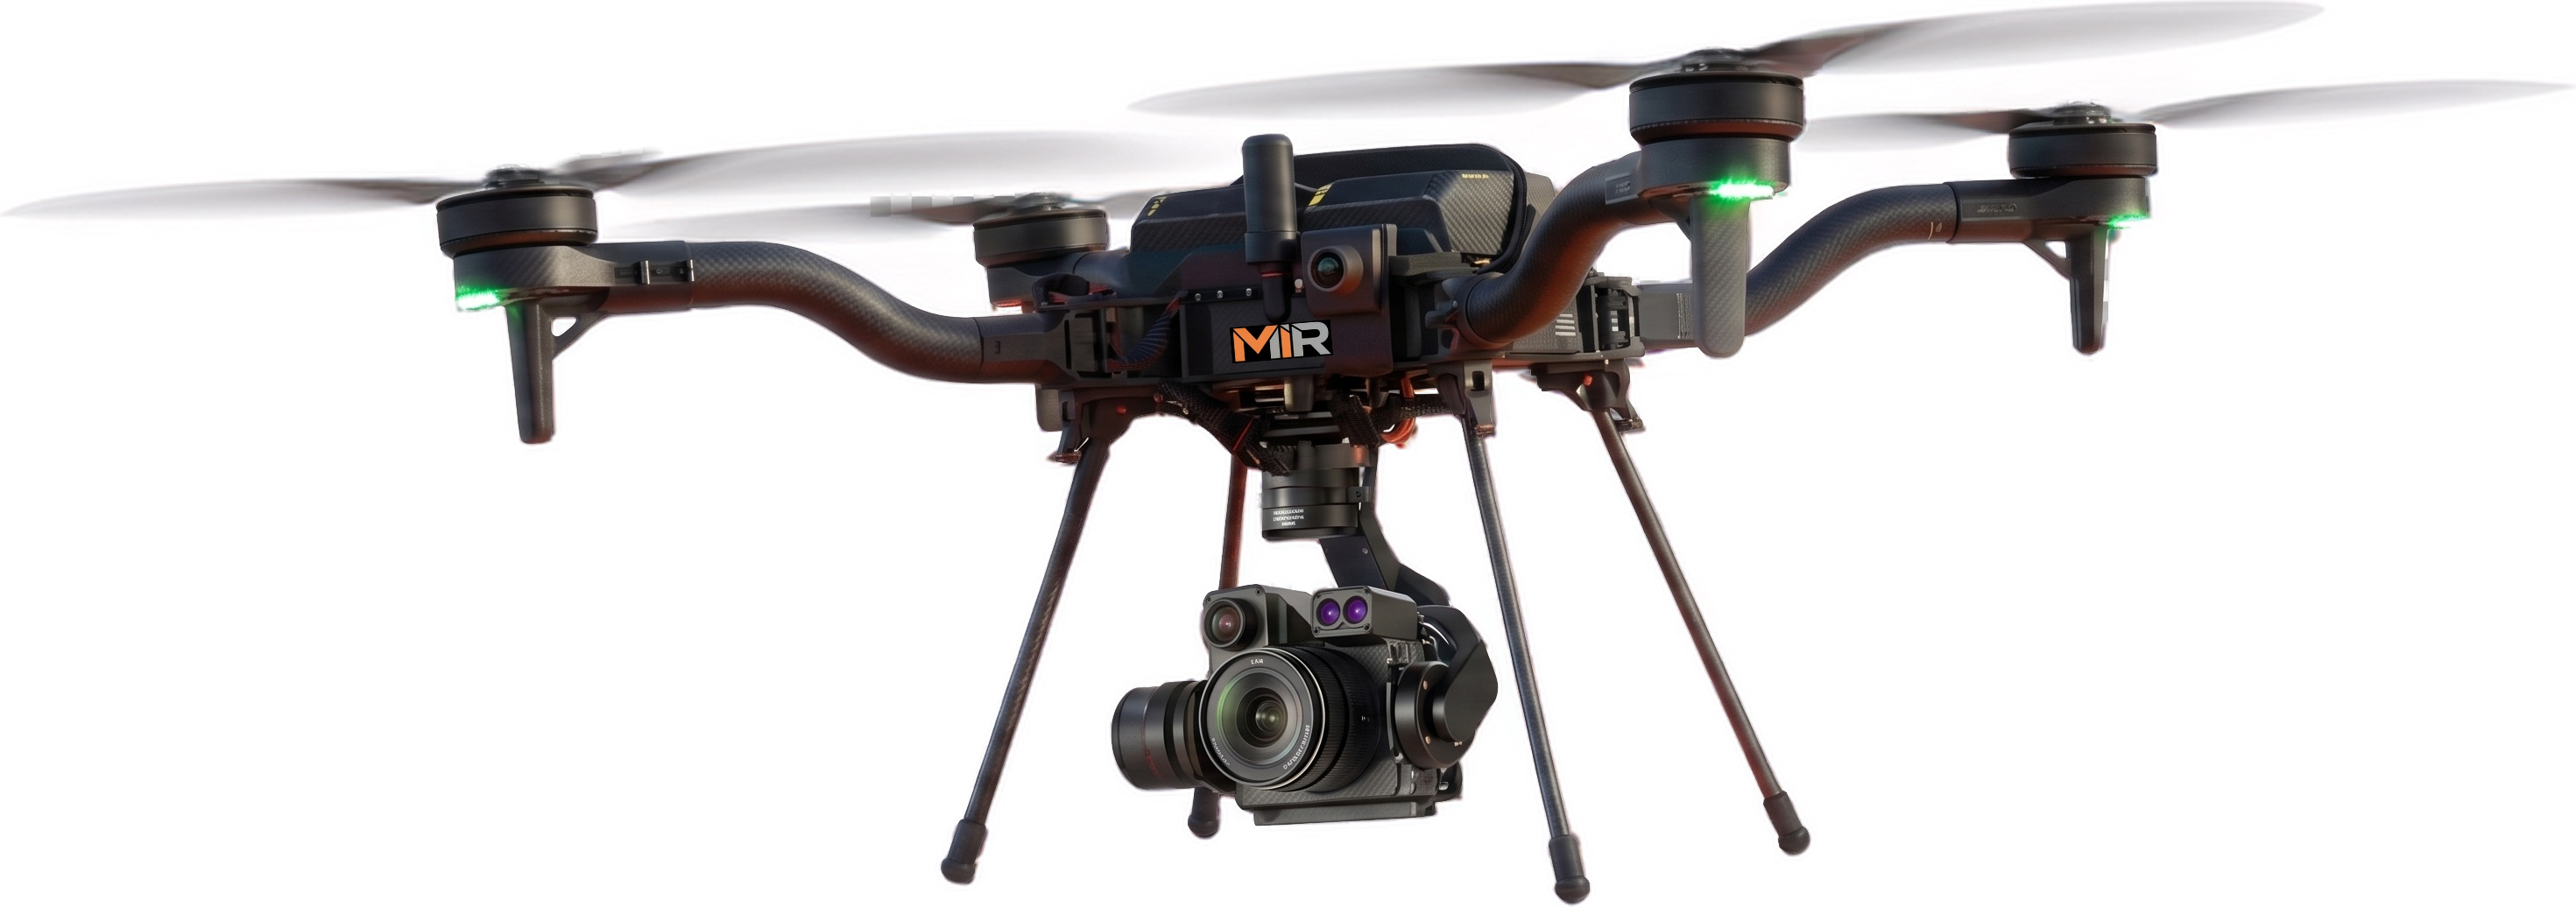
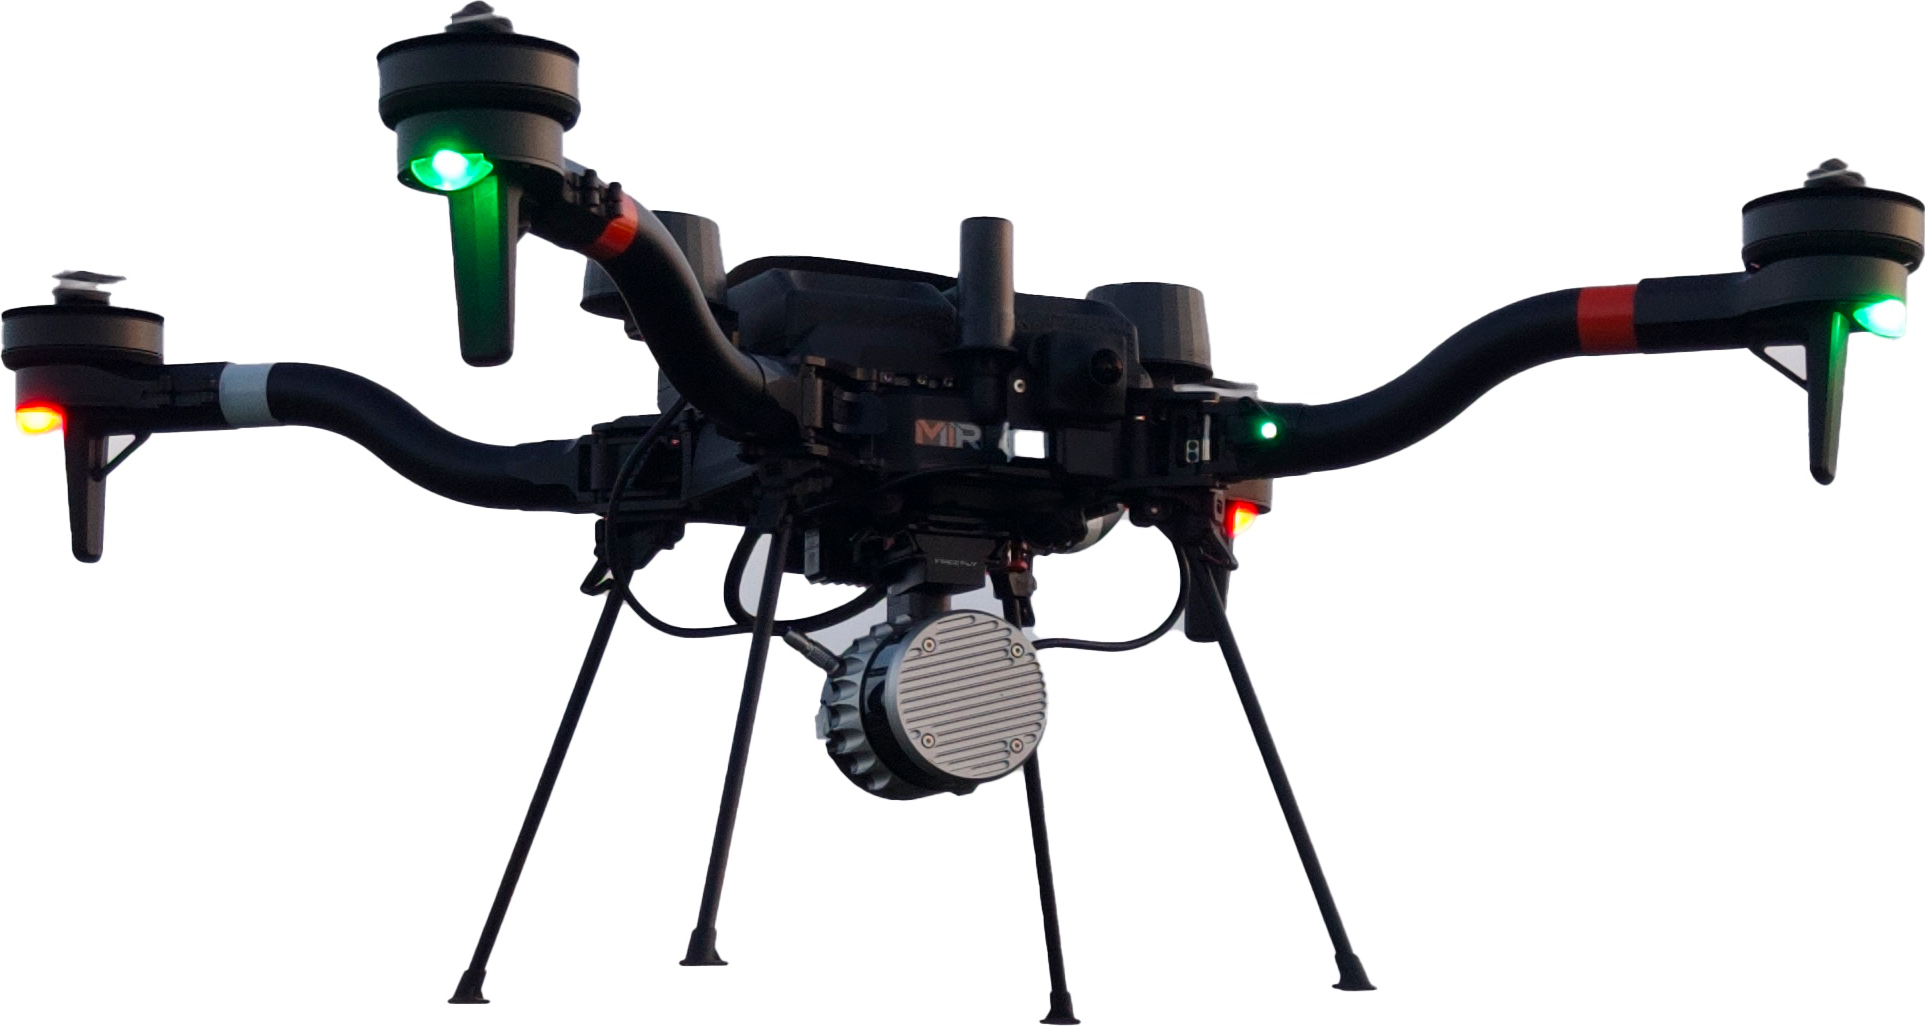
Dual American-made Freefly Astro platforms with RGB and LiDAR payloads for mission continuity.

Mobile Field Support
Charging, live viewing, and data review for sustained operations.
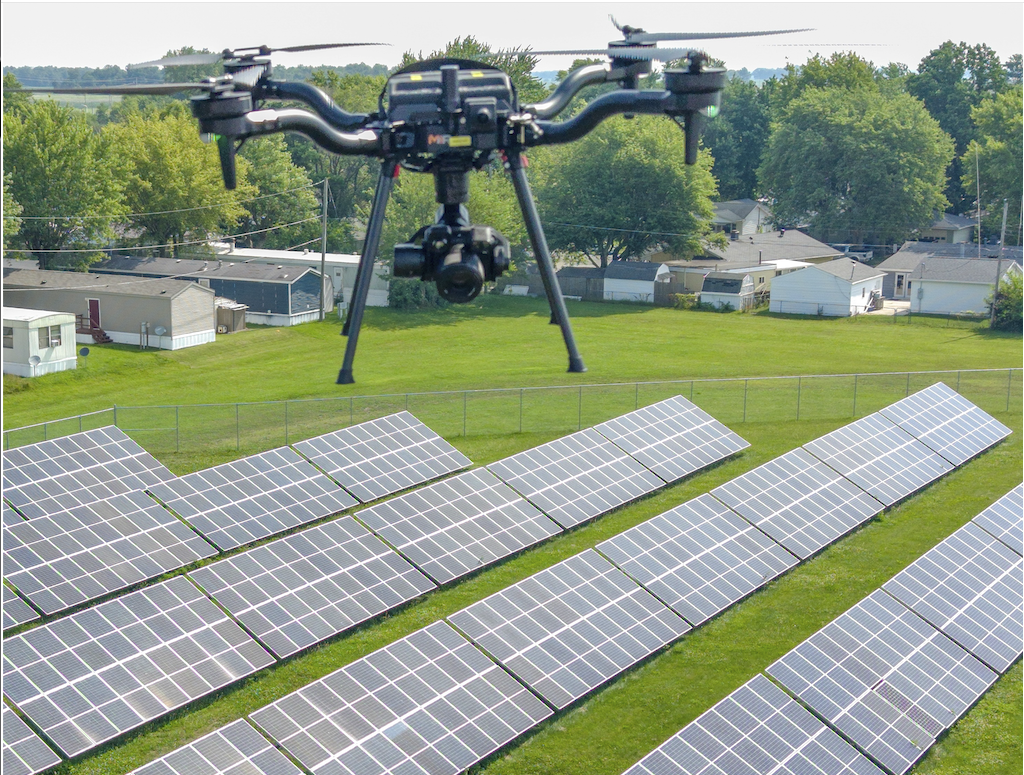
MIR Freefly Astro inspecting a ground-mounted solar array
Purpose-Built Data for Solar & Renewables
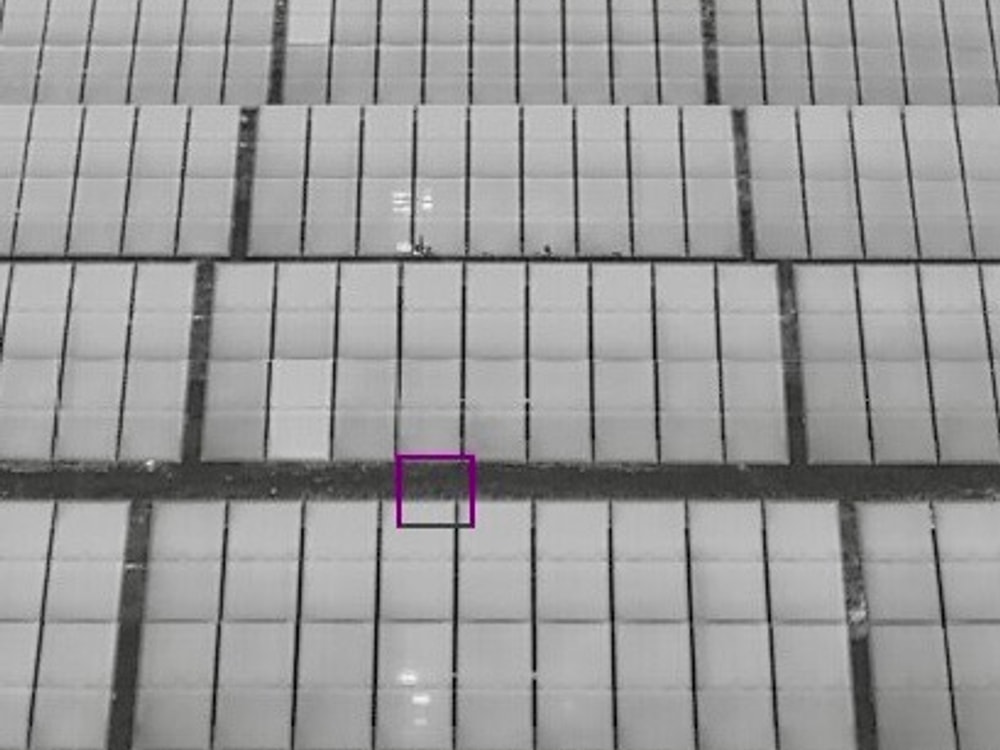
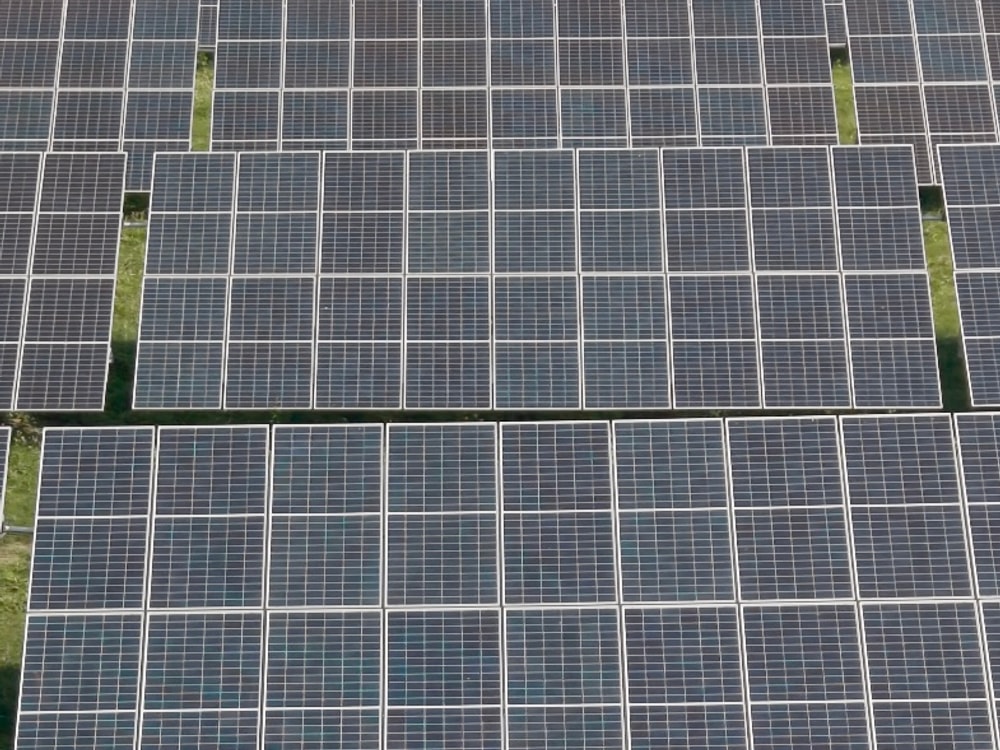
A single failed bypass diode or string outage can quietly erode production for months. MIR flies radiometric thermal and high-resolution missions in the right conditions — clear-sky irradiance and low wind to avoid thermal masking — then analyzes thermal and RGB side-by-side in Scopito, where anomalies are severity-classified and geolocated to the individual module, string, and combiner when site layout data supports it. Owners, EPCs, and O&M teams get baseline, commissioning, and O&M Scopito reports that tell them exactly what to fix, where it is, and how severe it is, across sites from a single rooftop to utility-scale.
 Thermal
 RGB
RGBFrom Flight Plan to Defect Map
Every solar & renewables project runs the same repeatable pipeline: missions are planned in UgCS, flown autonomously by AMC (Auterion Mission Control) on American-made Freefly Astro aircraft, then offloaded to the right software — Pix4Dmatic for mapping and photogrammetry, Scopito for inspection findings, and Freefly Flow for in-field LiDAR point clouds.
- Step 01

Mission Planning
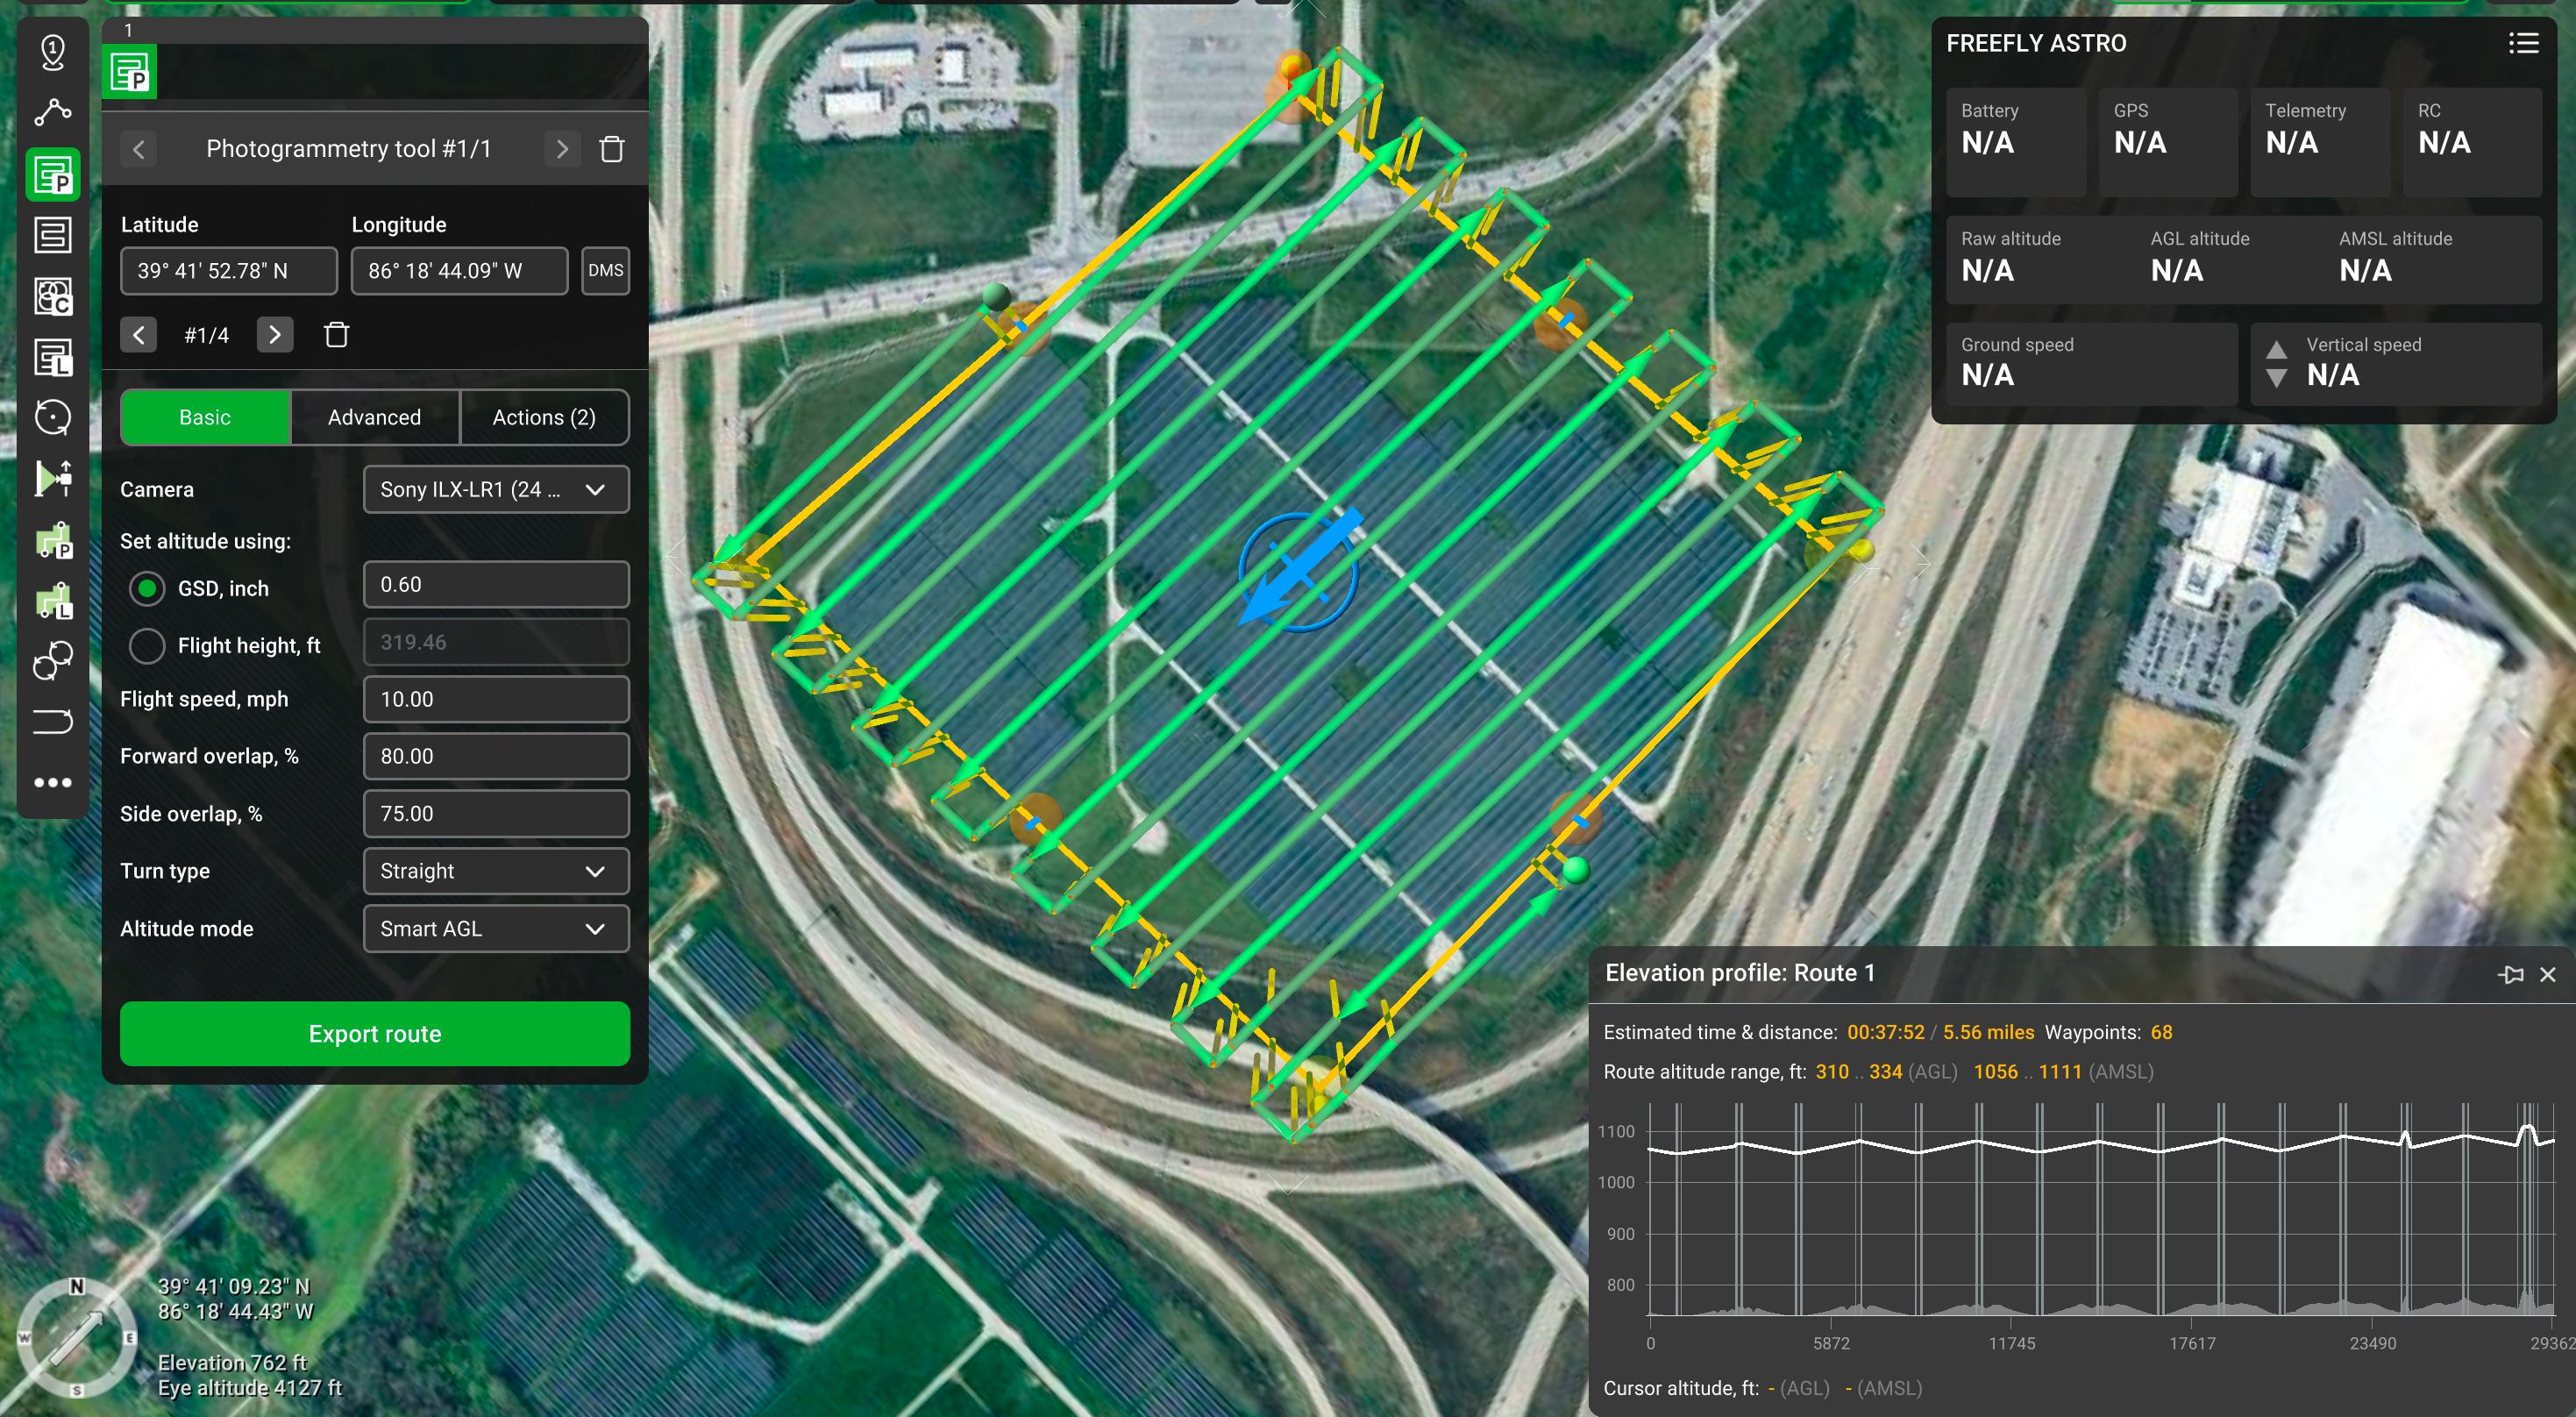
Arrays are programmed in UgCS with photogrammetry-area and corridor grids at a fixed Ground Sampling Distance and overlap, timed to clear-sky irradiance and low-wind windows for valid thermography.
- Step 02


Field Capture
The UgCS mission is transferred by USB to the Herelink controller and uploaded to AMC (Auterion Mission Control), which flies the radiometric thermal and high-resolution RGB passes autonomously on American-made Freefly Astro aircraft, capturing temperature-referenced data suitable for warranty and due-diligence use.
- Step 03


Processing & Reporting
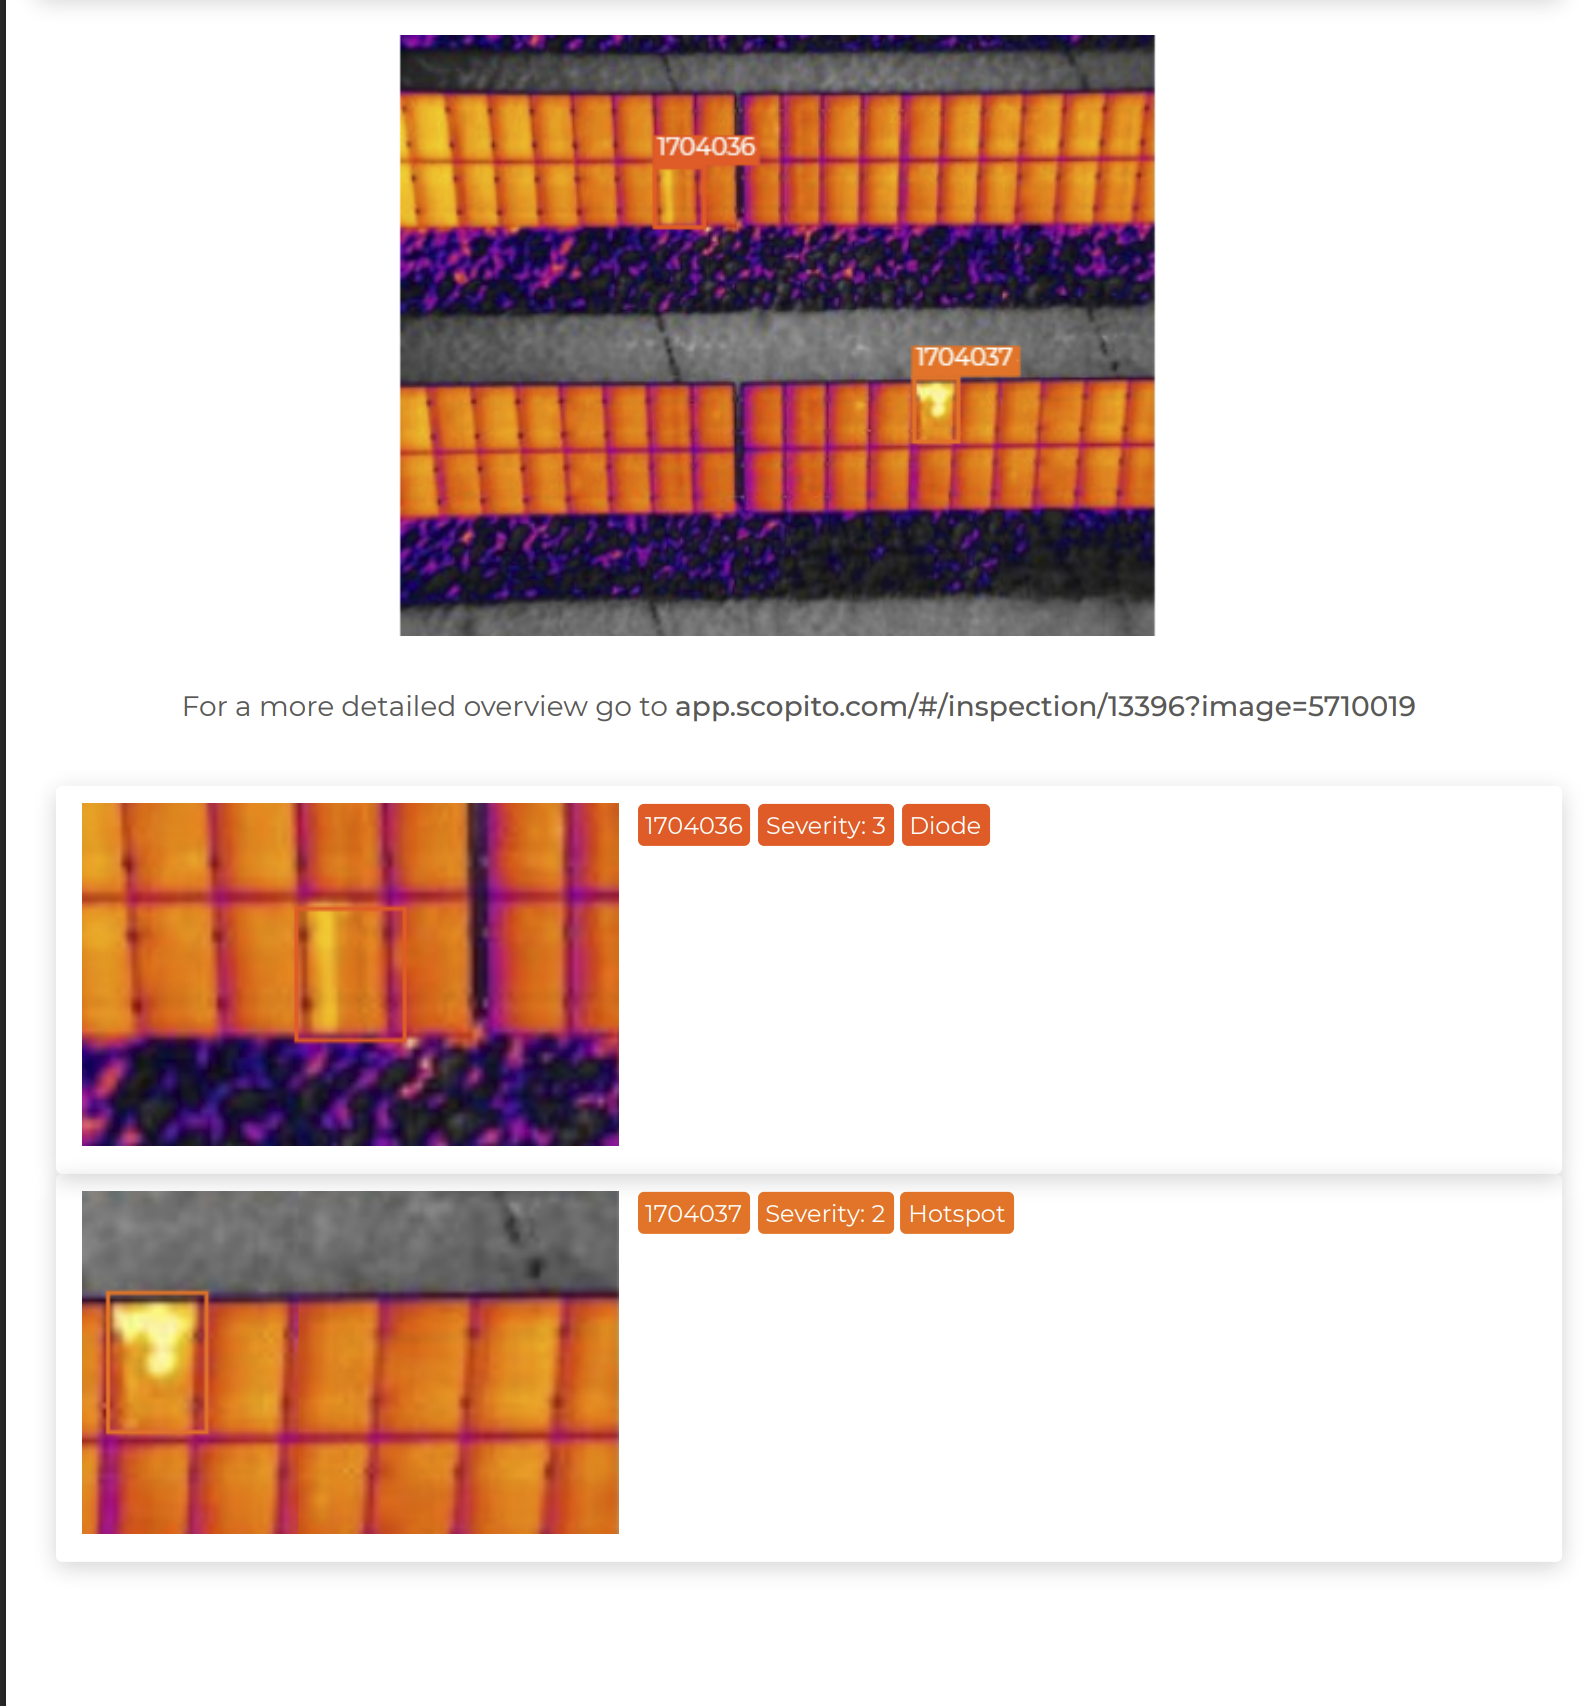
Orthomosaics are built in Pix4Dmatic while thermal and RGB are analyzed side-by-side in Scopito, where anomalies are severity-classified and geolocated to module, string, and combiner when site layout data supports it — producing an actionable defect map and report.
Services MIR Provides
Radiometric Thermography
Temperature-referenced thermal capture to identify hot spots, bypass-diode failures, PID, and string and module outages under suitable clear-sky, low-wind conditions.
Module & String Anomaly Mapping
Anomalies severity-classified and mapped to physical module, string, and combiner positions, when site layout data supports it, for targeted field response.
Site Orthomosaics & Mapping
RTK-referenced orthomosaics and site maps of arrays, land, and surrounding infrastructure.
Commissioning & Warranty Documentation
Baseline and acceptance records to support commissioning, warranty claims, and third-party due diligence.
Tracker & Physical-Condition Inspections
Flag stuck or misaligned tracker rows, visibly damaged modules, debris, soiling, and obvious tracker or racking damage.
Vegetation & Shading Documentation
Identify problem areas, verify mowing results, and show where vegetation is approaching or shading panels.
Drainage & Erosion Mapping
Document standing water, washouts, damaged access roads, blocked drainage, and erosion-control failures.
Post-Storm Damage Response
Rapid hail, wind, tornado, and flood assessment for repair planning, warranty claims, and insurance documentation.
Repeat & Comparative Inspections
Reinspect after repairs and compare the same locations over time to confirm fixes and track change.
Balance-of-Plant Inspections
Targeted RGB and thermal inspection of accessible inverter areas, substations, fencing, and the generation-tie line where site procedures allow.
The Equipment We Bring To Your Site
Each project is scoped to the required collection method. RGB, radiometric thermal, and LiDAR are deployed in purpose-built acquisition passes based on the required deliverables — RTK-referenced so your data comes back well-documented and ready to use.
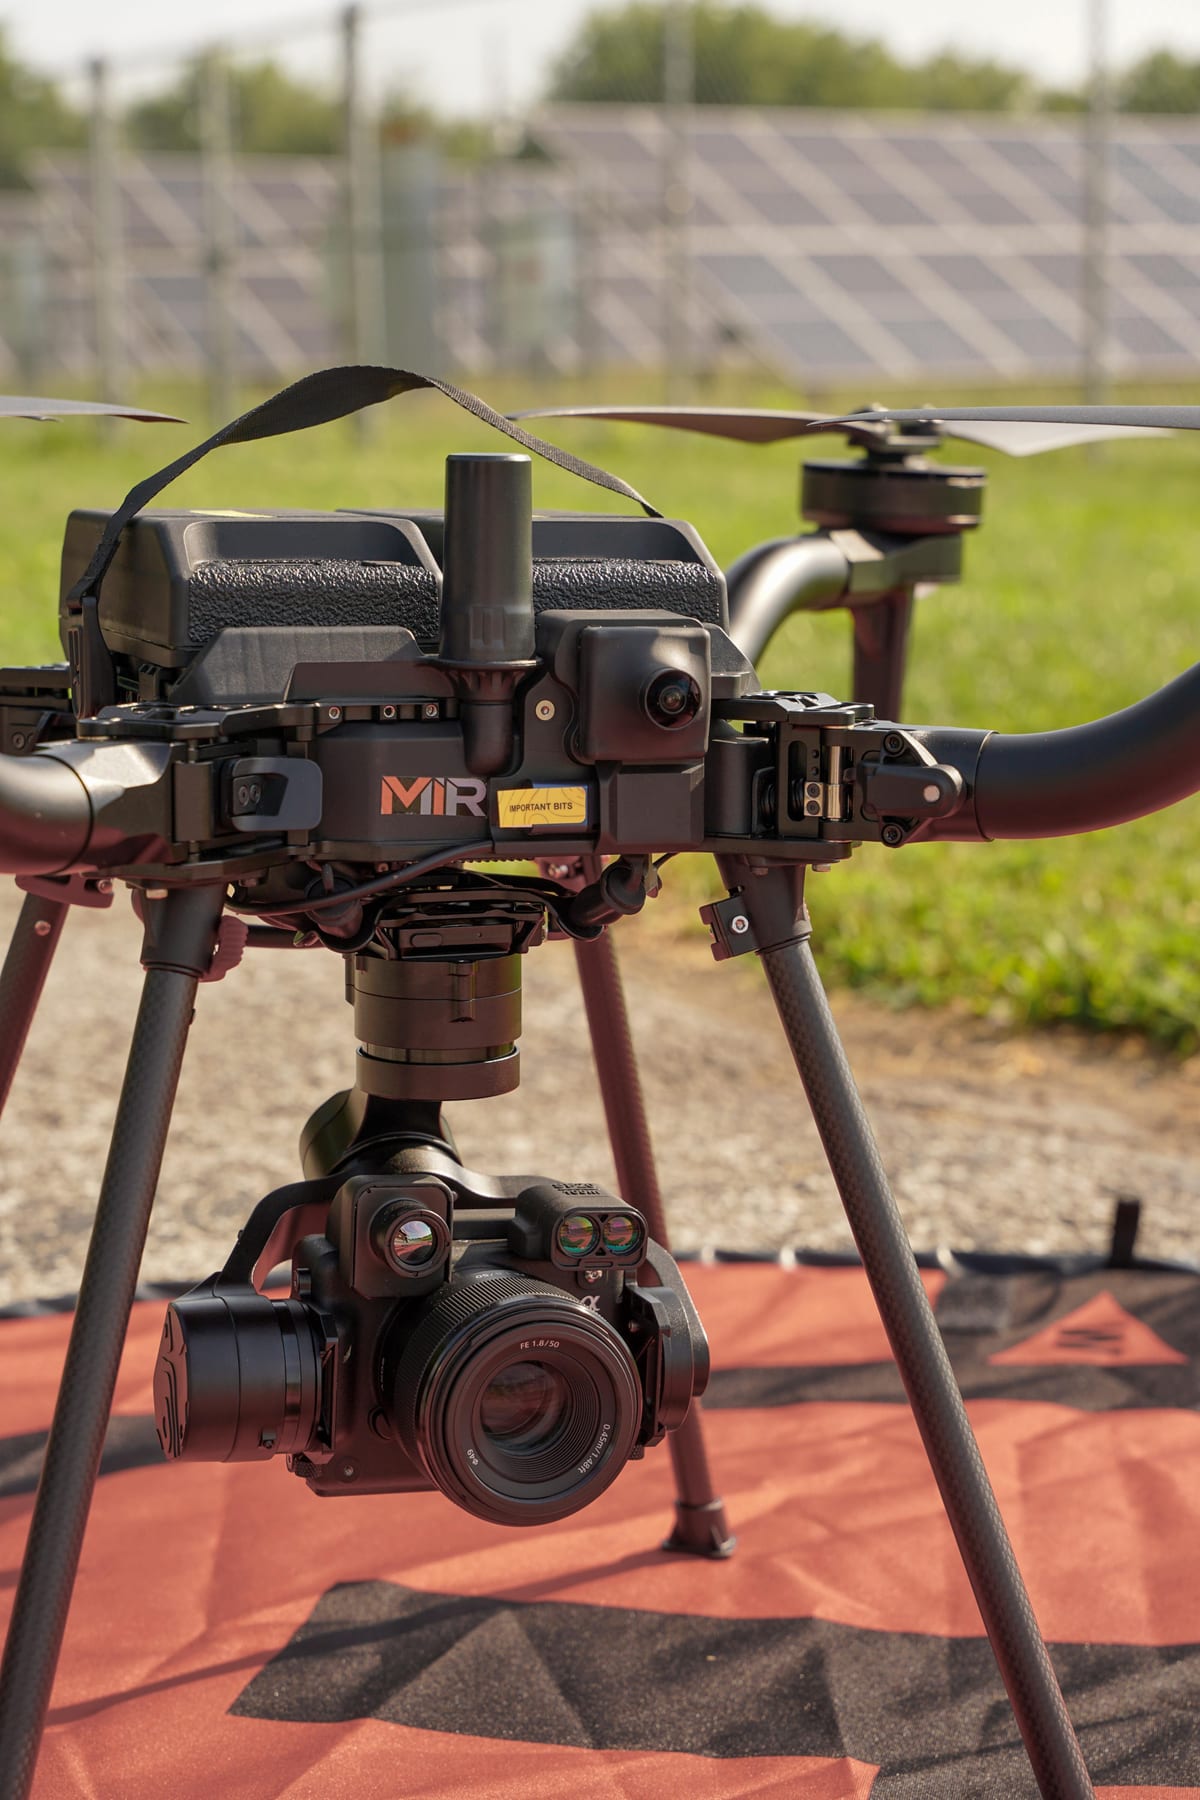
Freefly Astro
Blue UAS aircraft
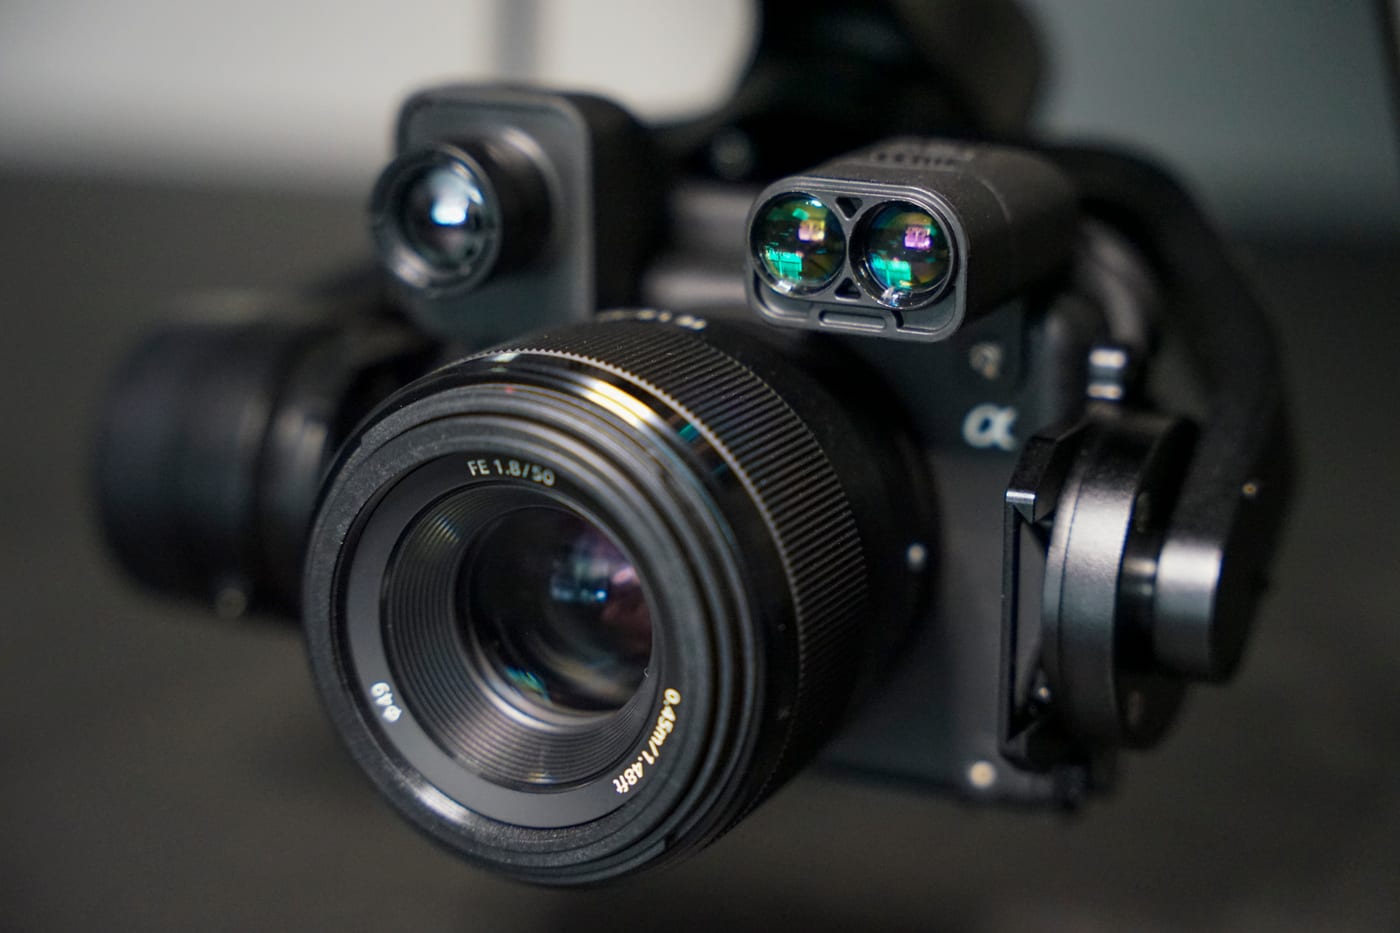
Sony 61MP RGB
High-resolution imagery
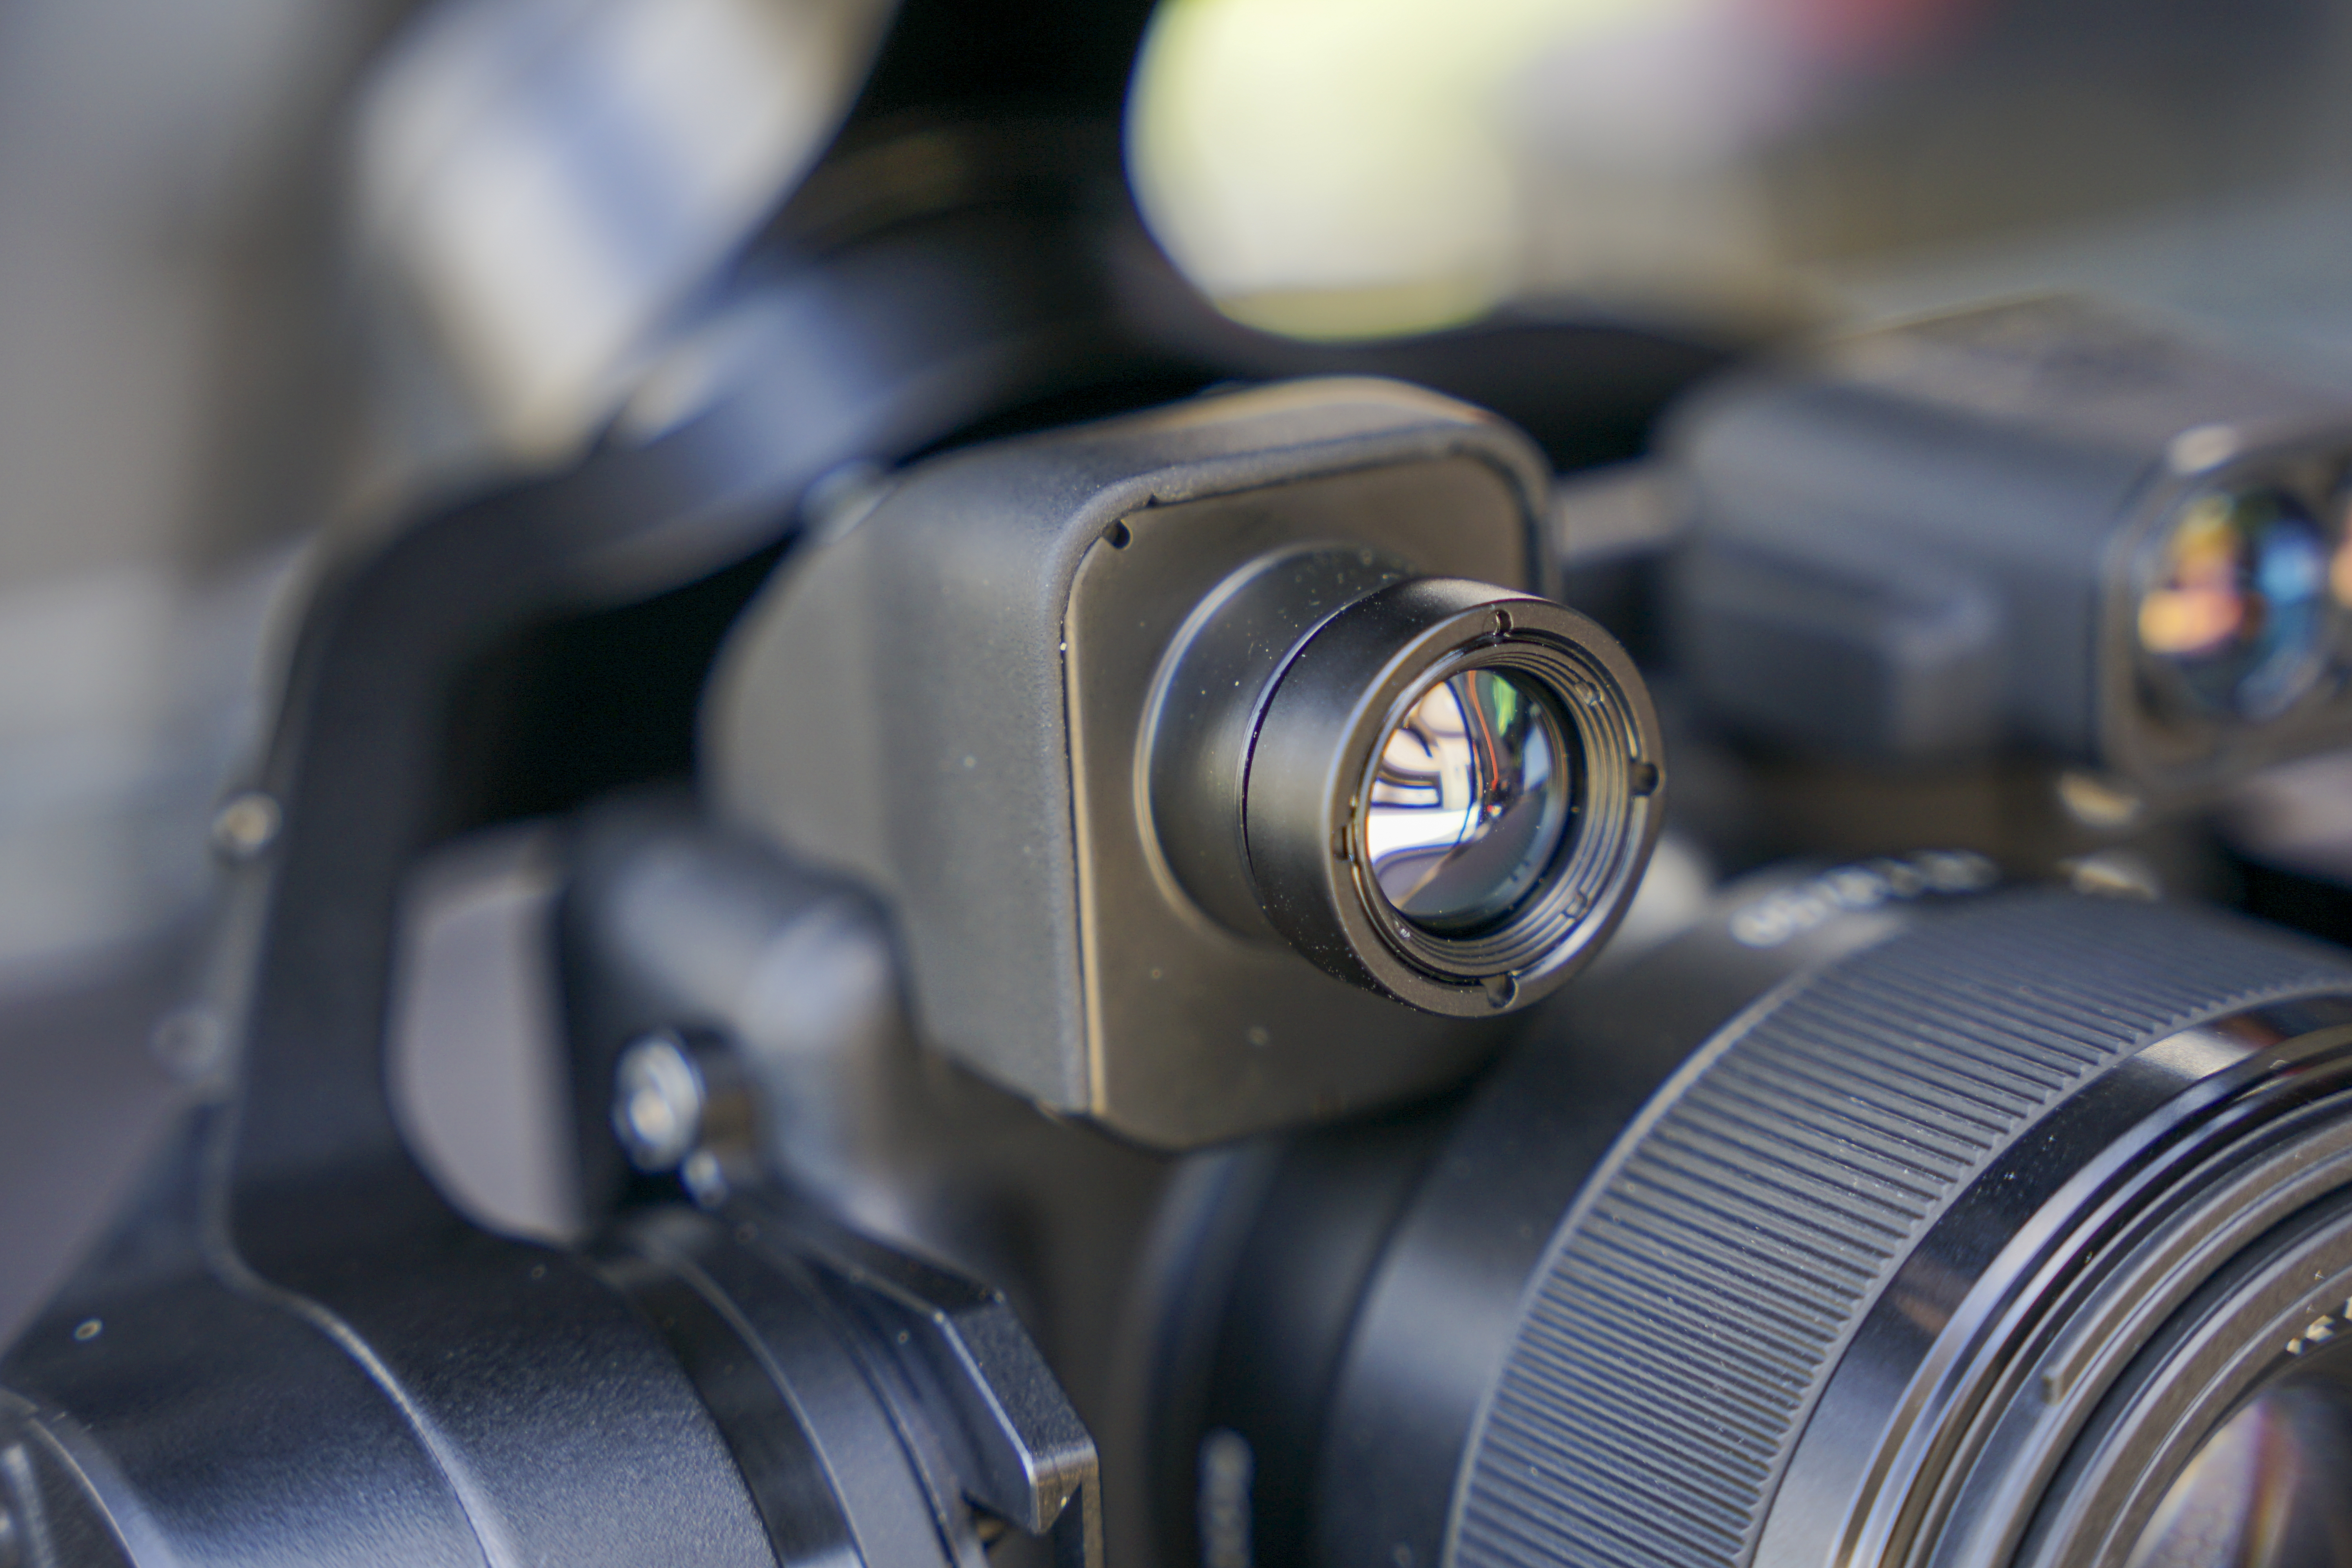
Radiometric Thermal
Calibrated heat mapping
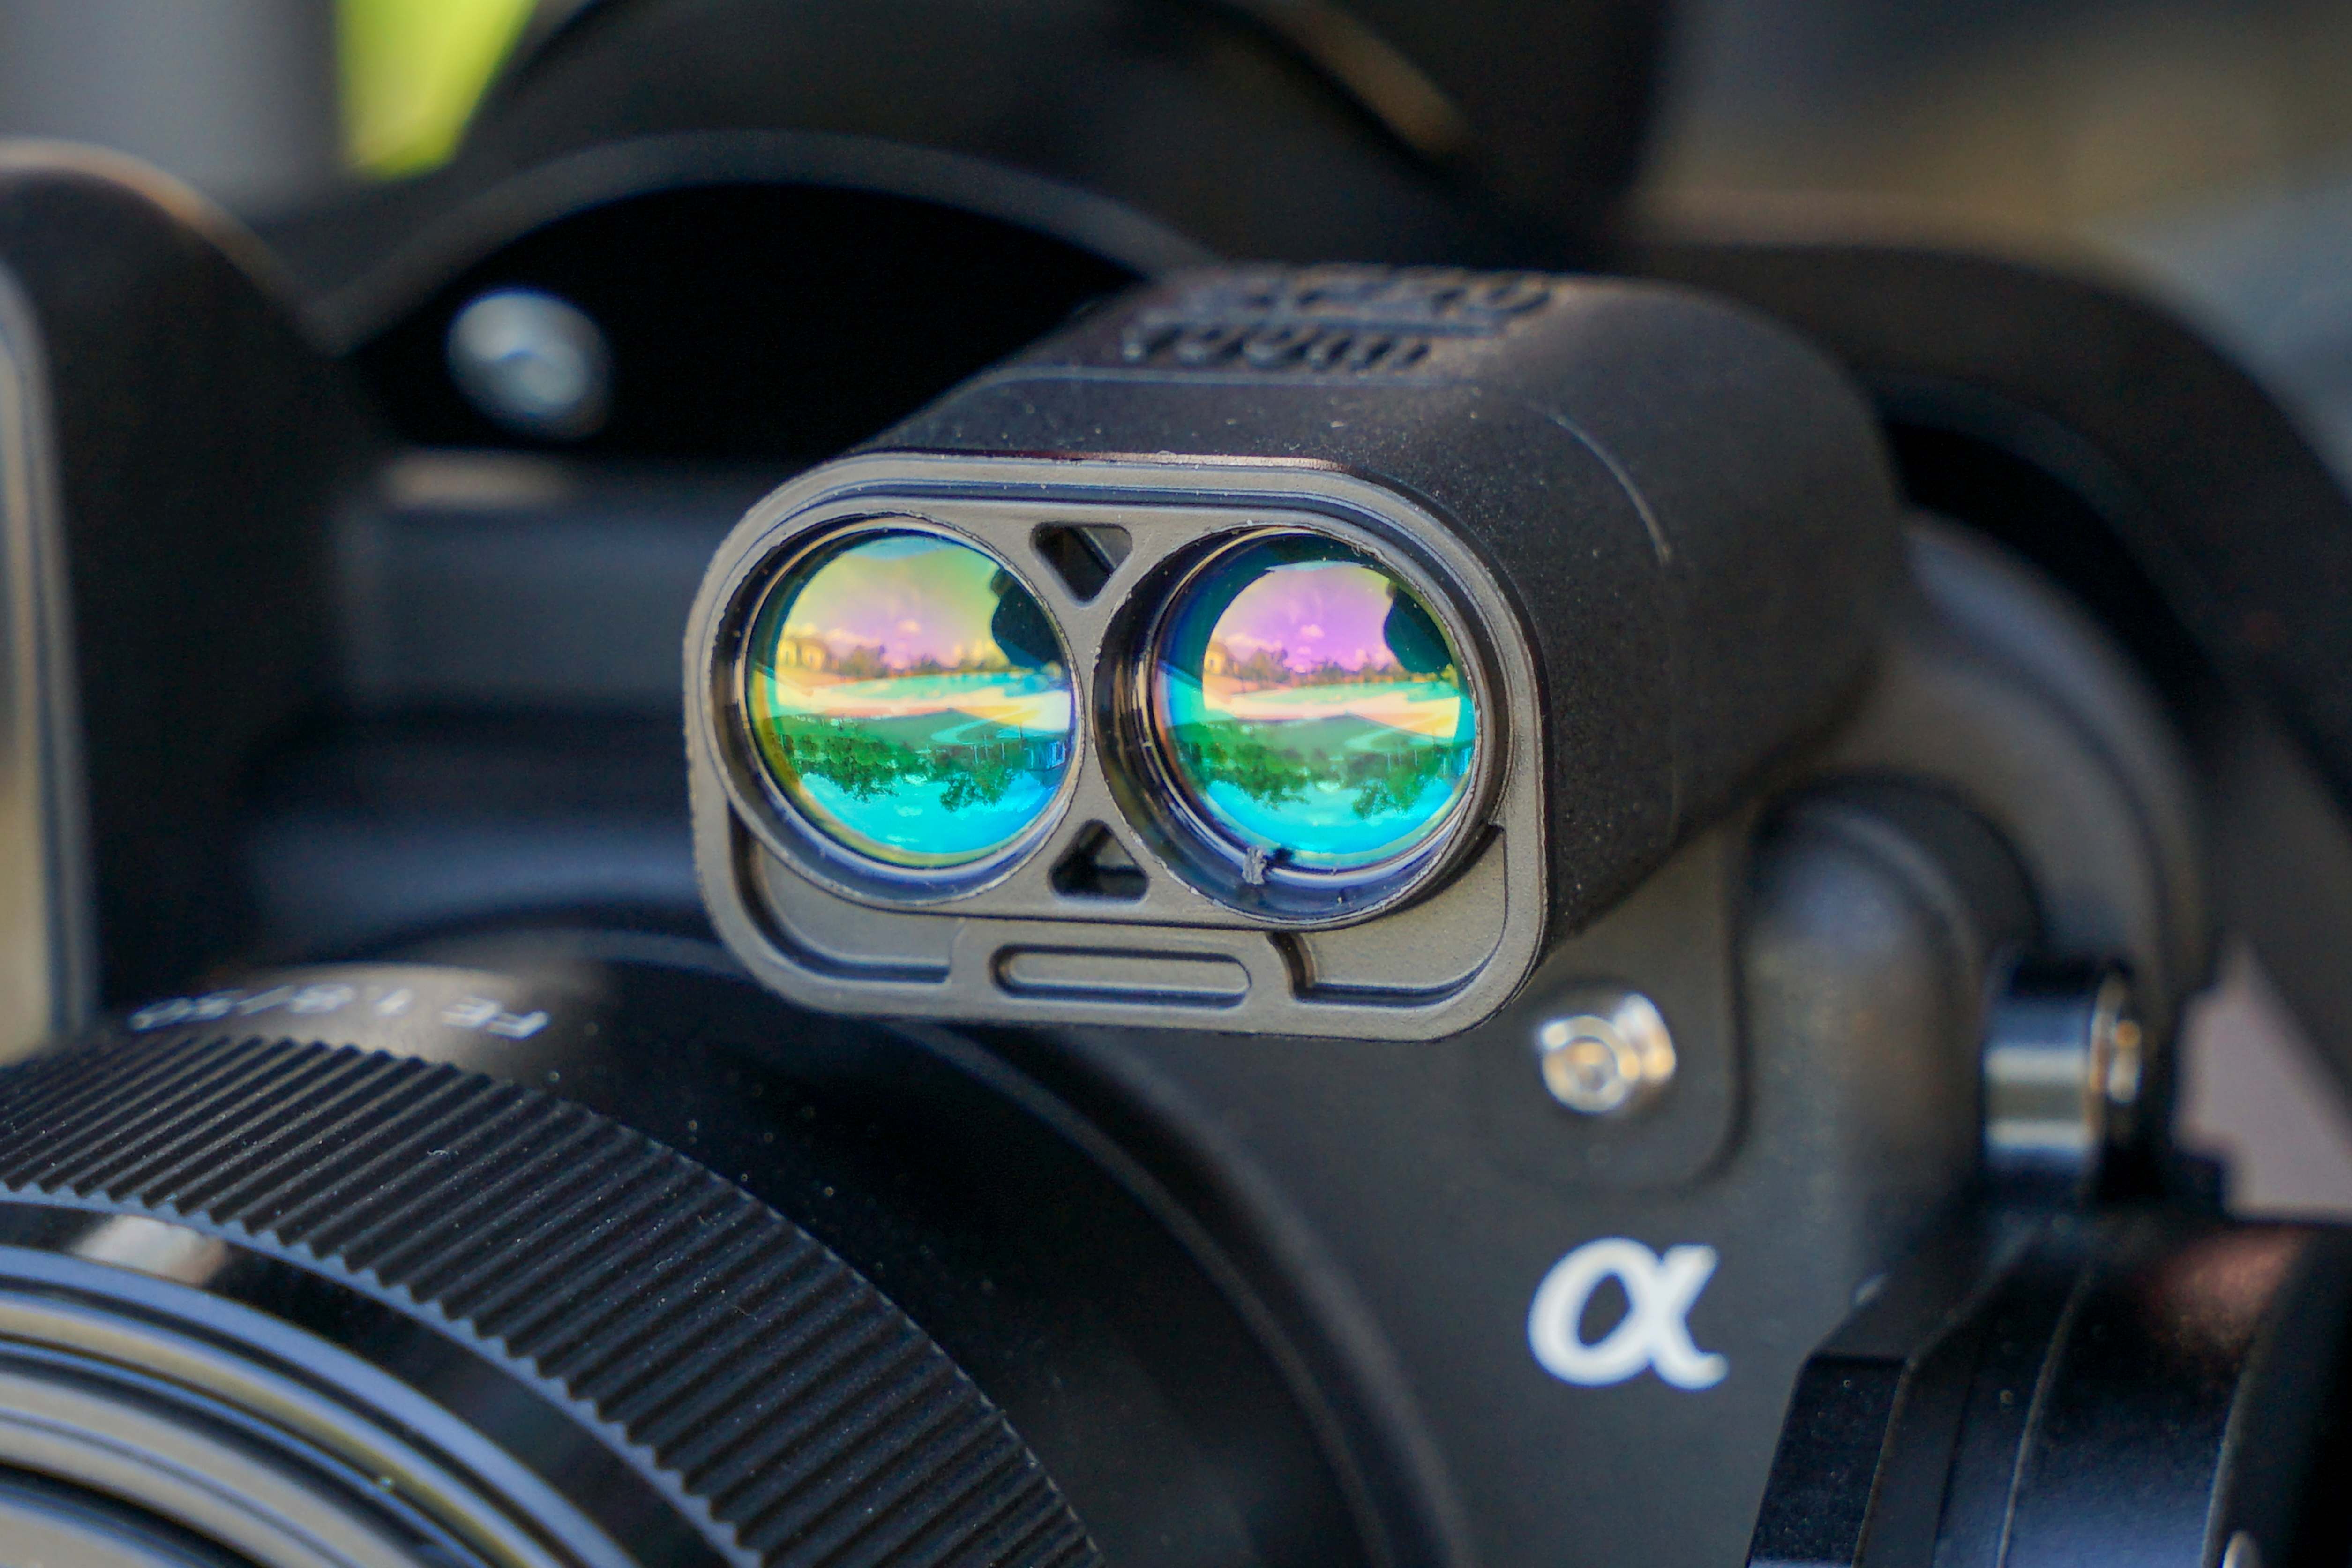
Laser Rangefinder
Direct distance & clearance
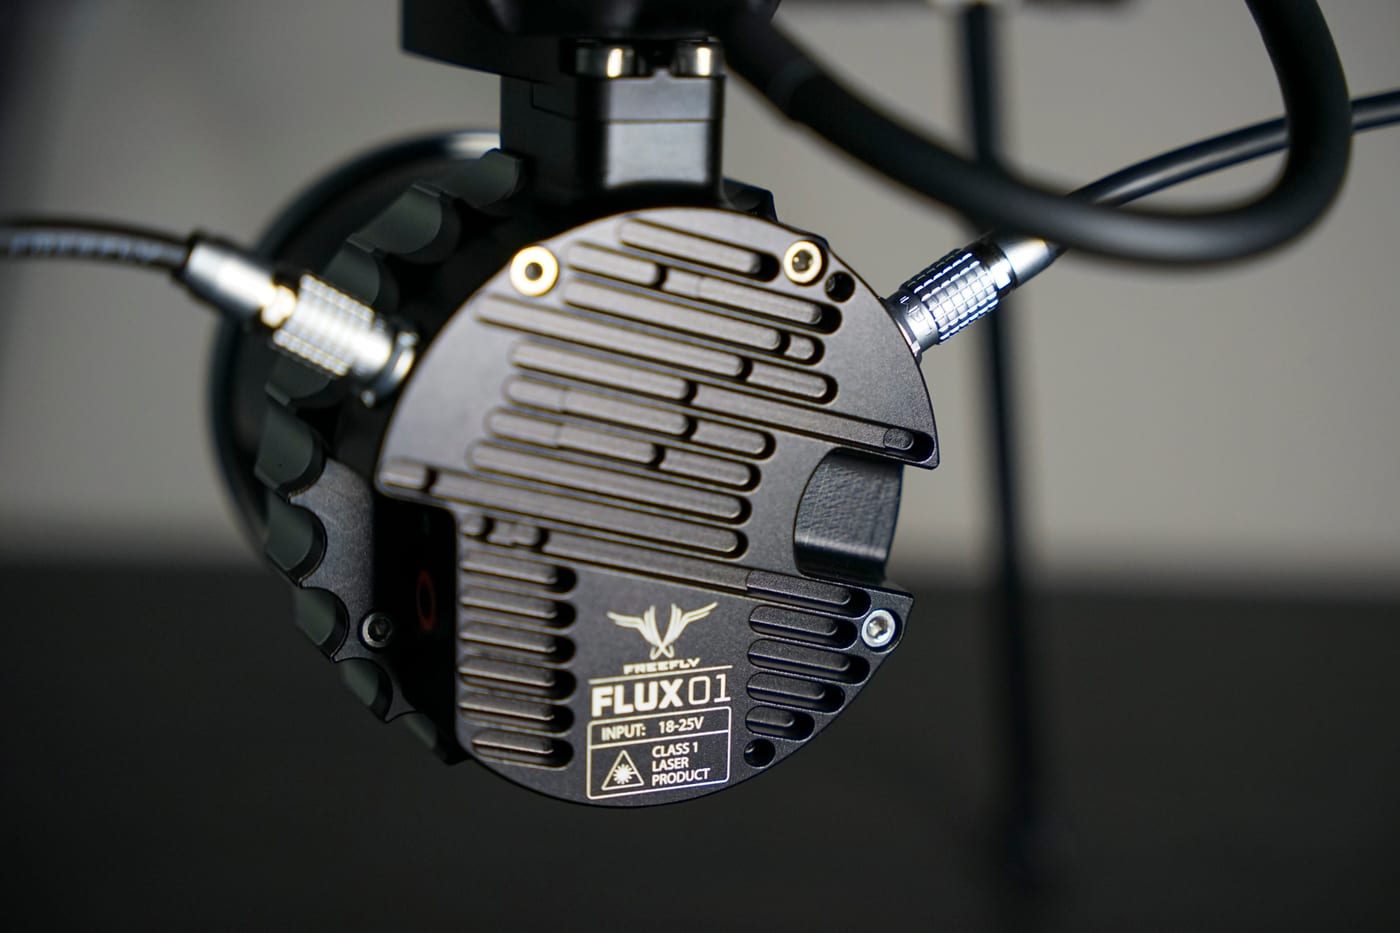
Freefly Flux O1
LiDAR acquisition
RTK Positioning
InCORS NTRIP · WGS 84
Every anomaly, down to the module
One thermal sweep, one file. Anomalies classified, severity-graded, and mapped to module, string, and combiner when site layout data supports it.
Radiometric thermography
Radiometric FLIR thermal capture flown in the right conditions — clear-sky irradiance and low wind.
Module & string mapping
Anomalies keyed to their physical module, string, and combiner when site layout data supports it.
Severity grading
Hot spots, diode failures, and string outages classified and reviewed.
Report Sample
Inside a Scopito Solar Report
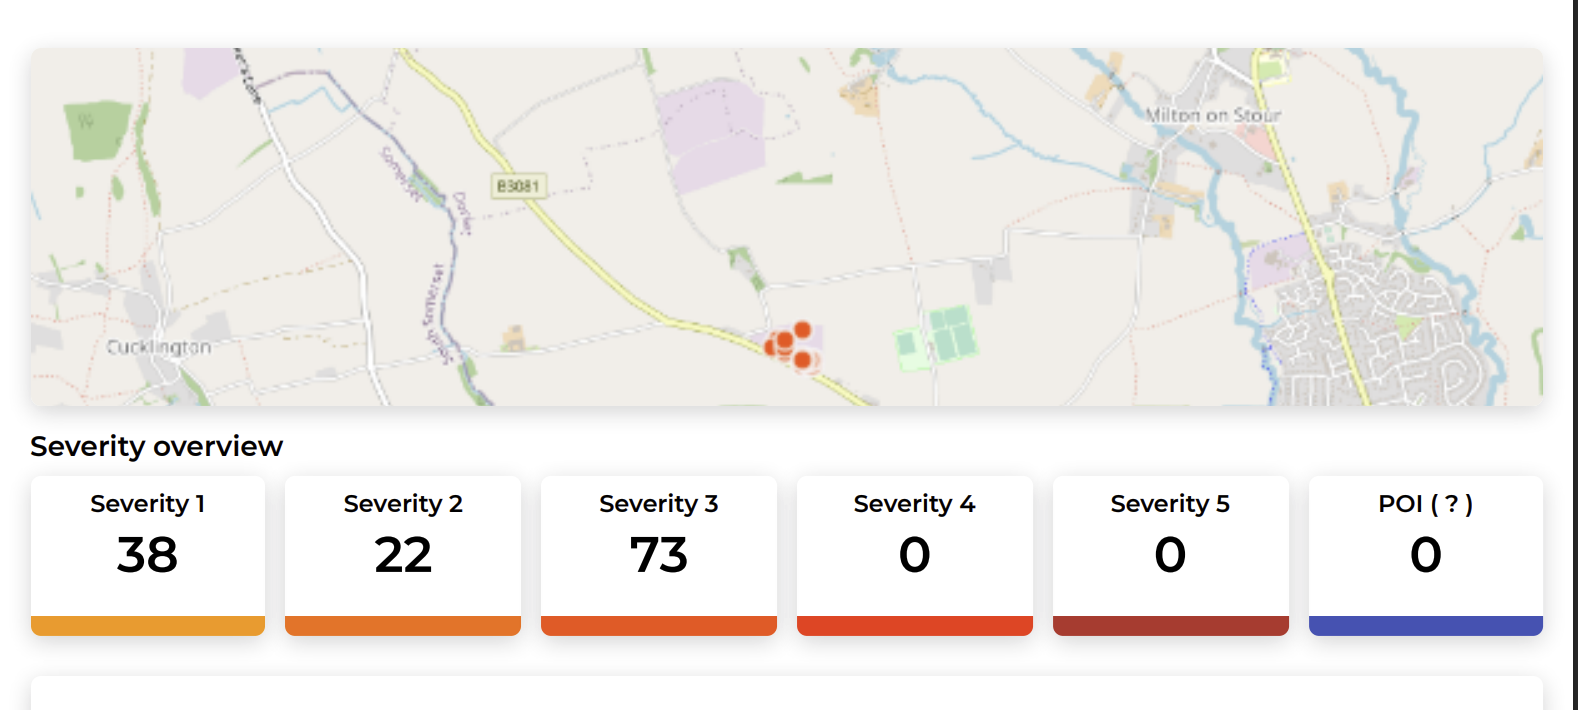
Site severity overview across all modules
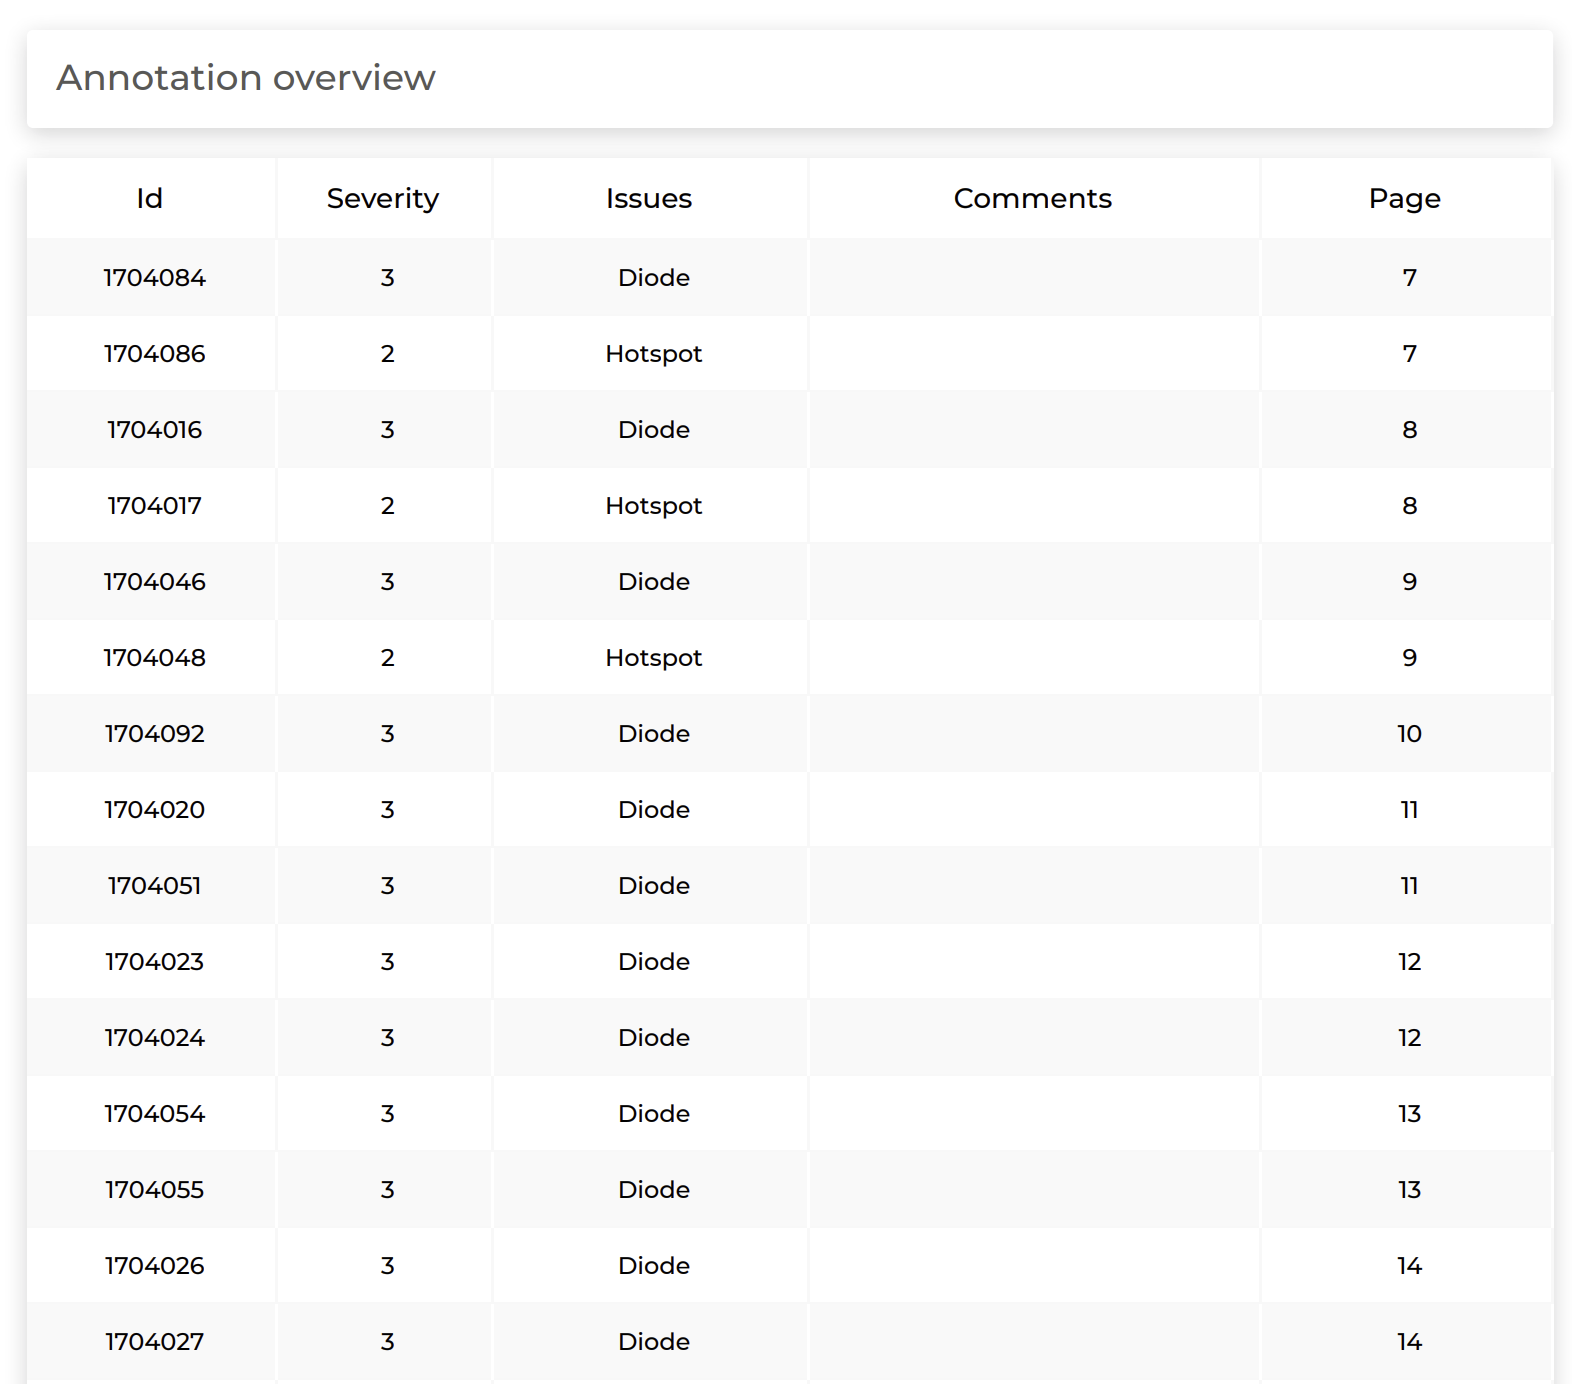
Full anomaly register keyed to module and string
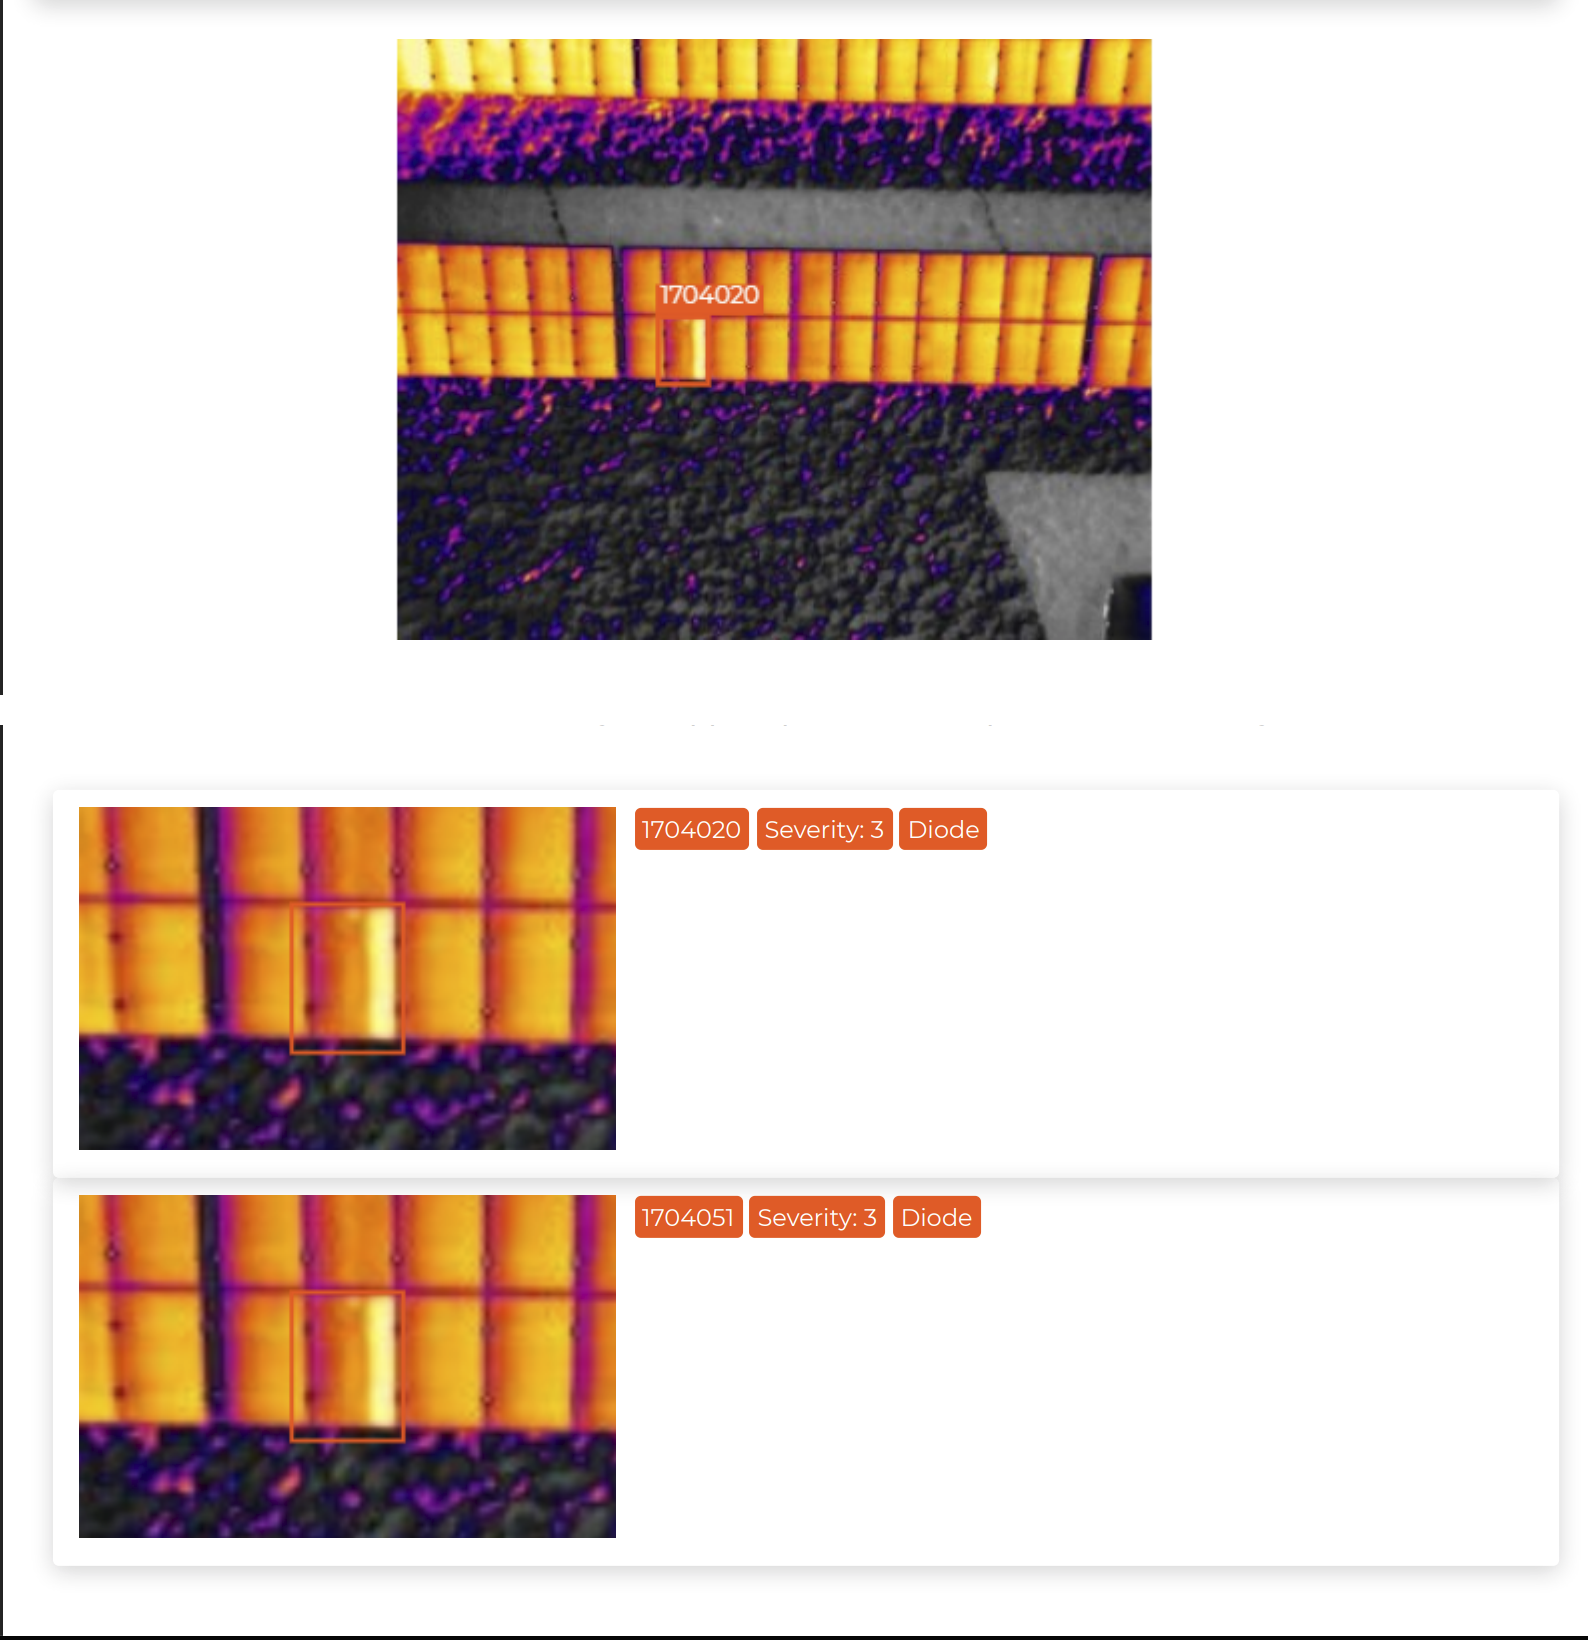
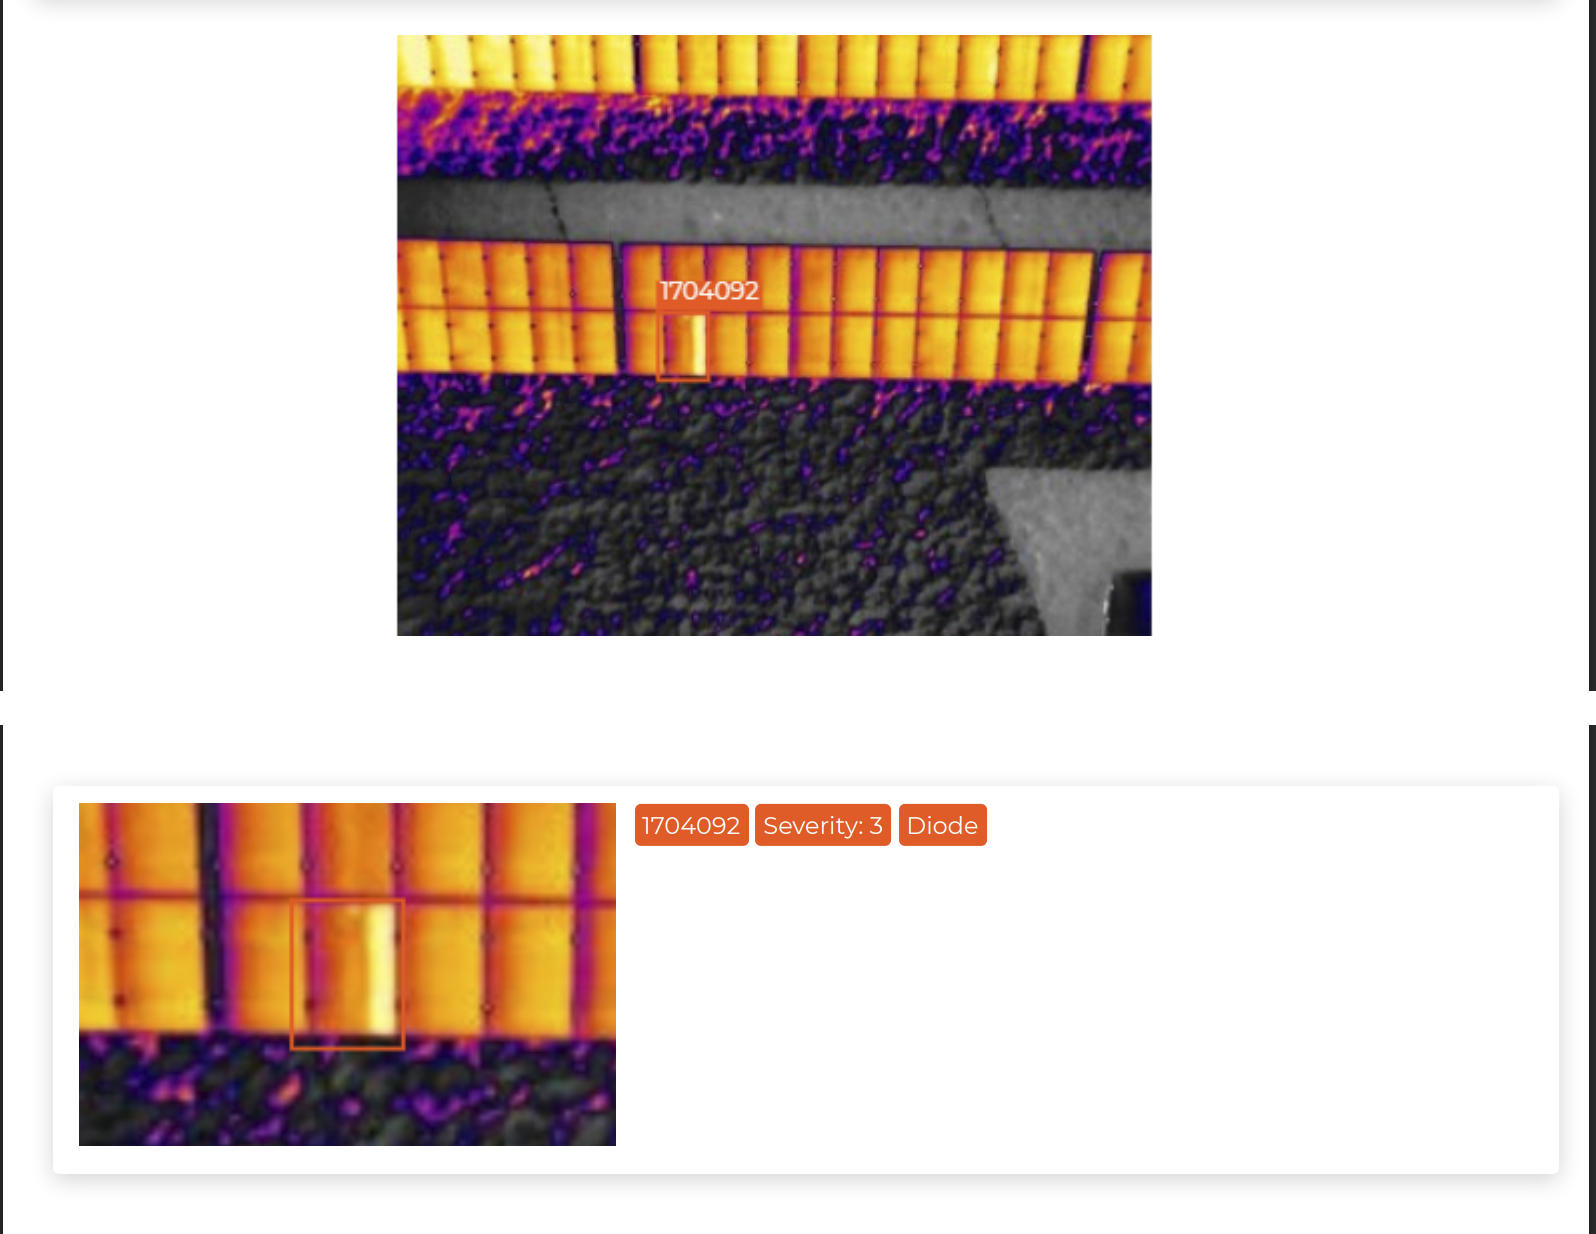 Sev 3 · Diode
Bypass-diode failure pinpointed in thermal
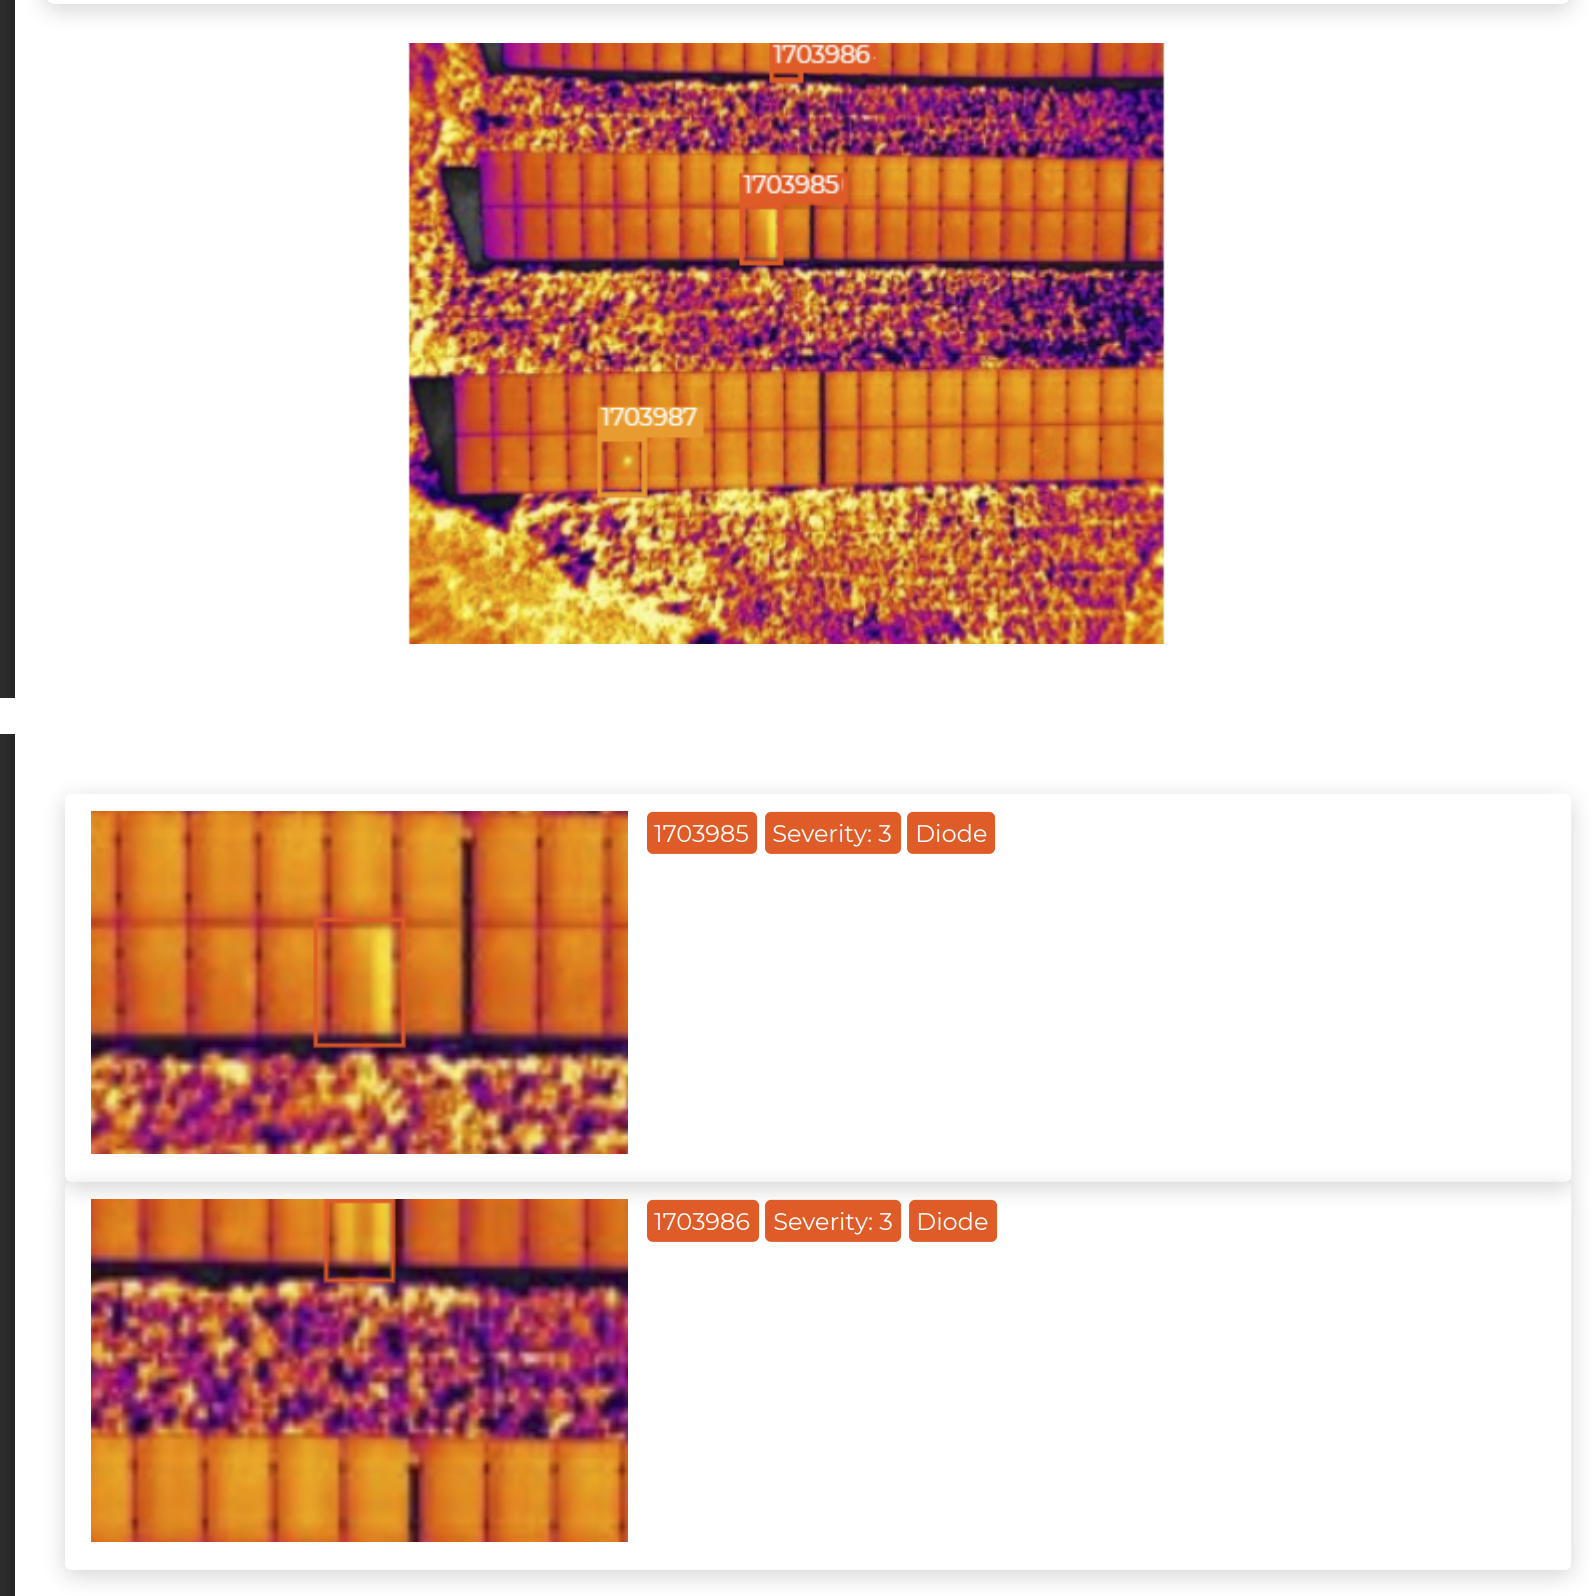
 Sev 3 · Diode
String diode failures located by thermal signature
 Sev 3 · Diode
Adjacent diode failures flagged on one pass
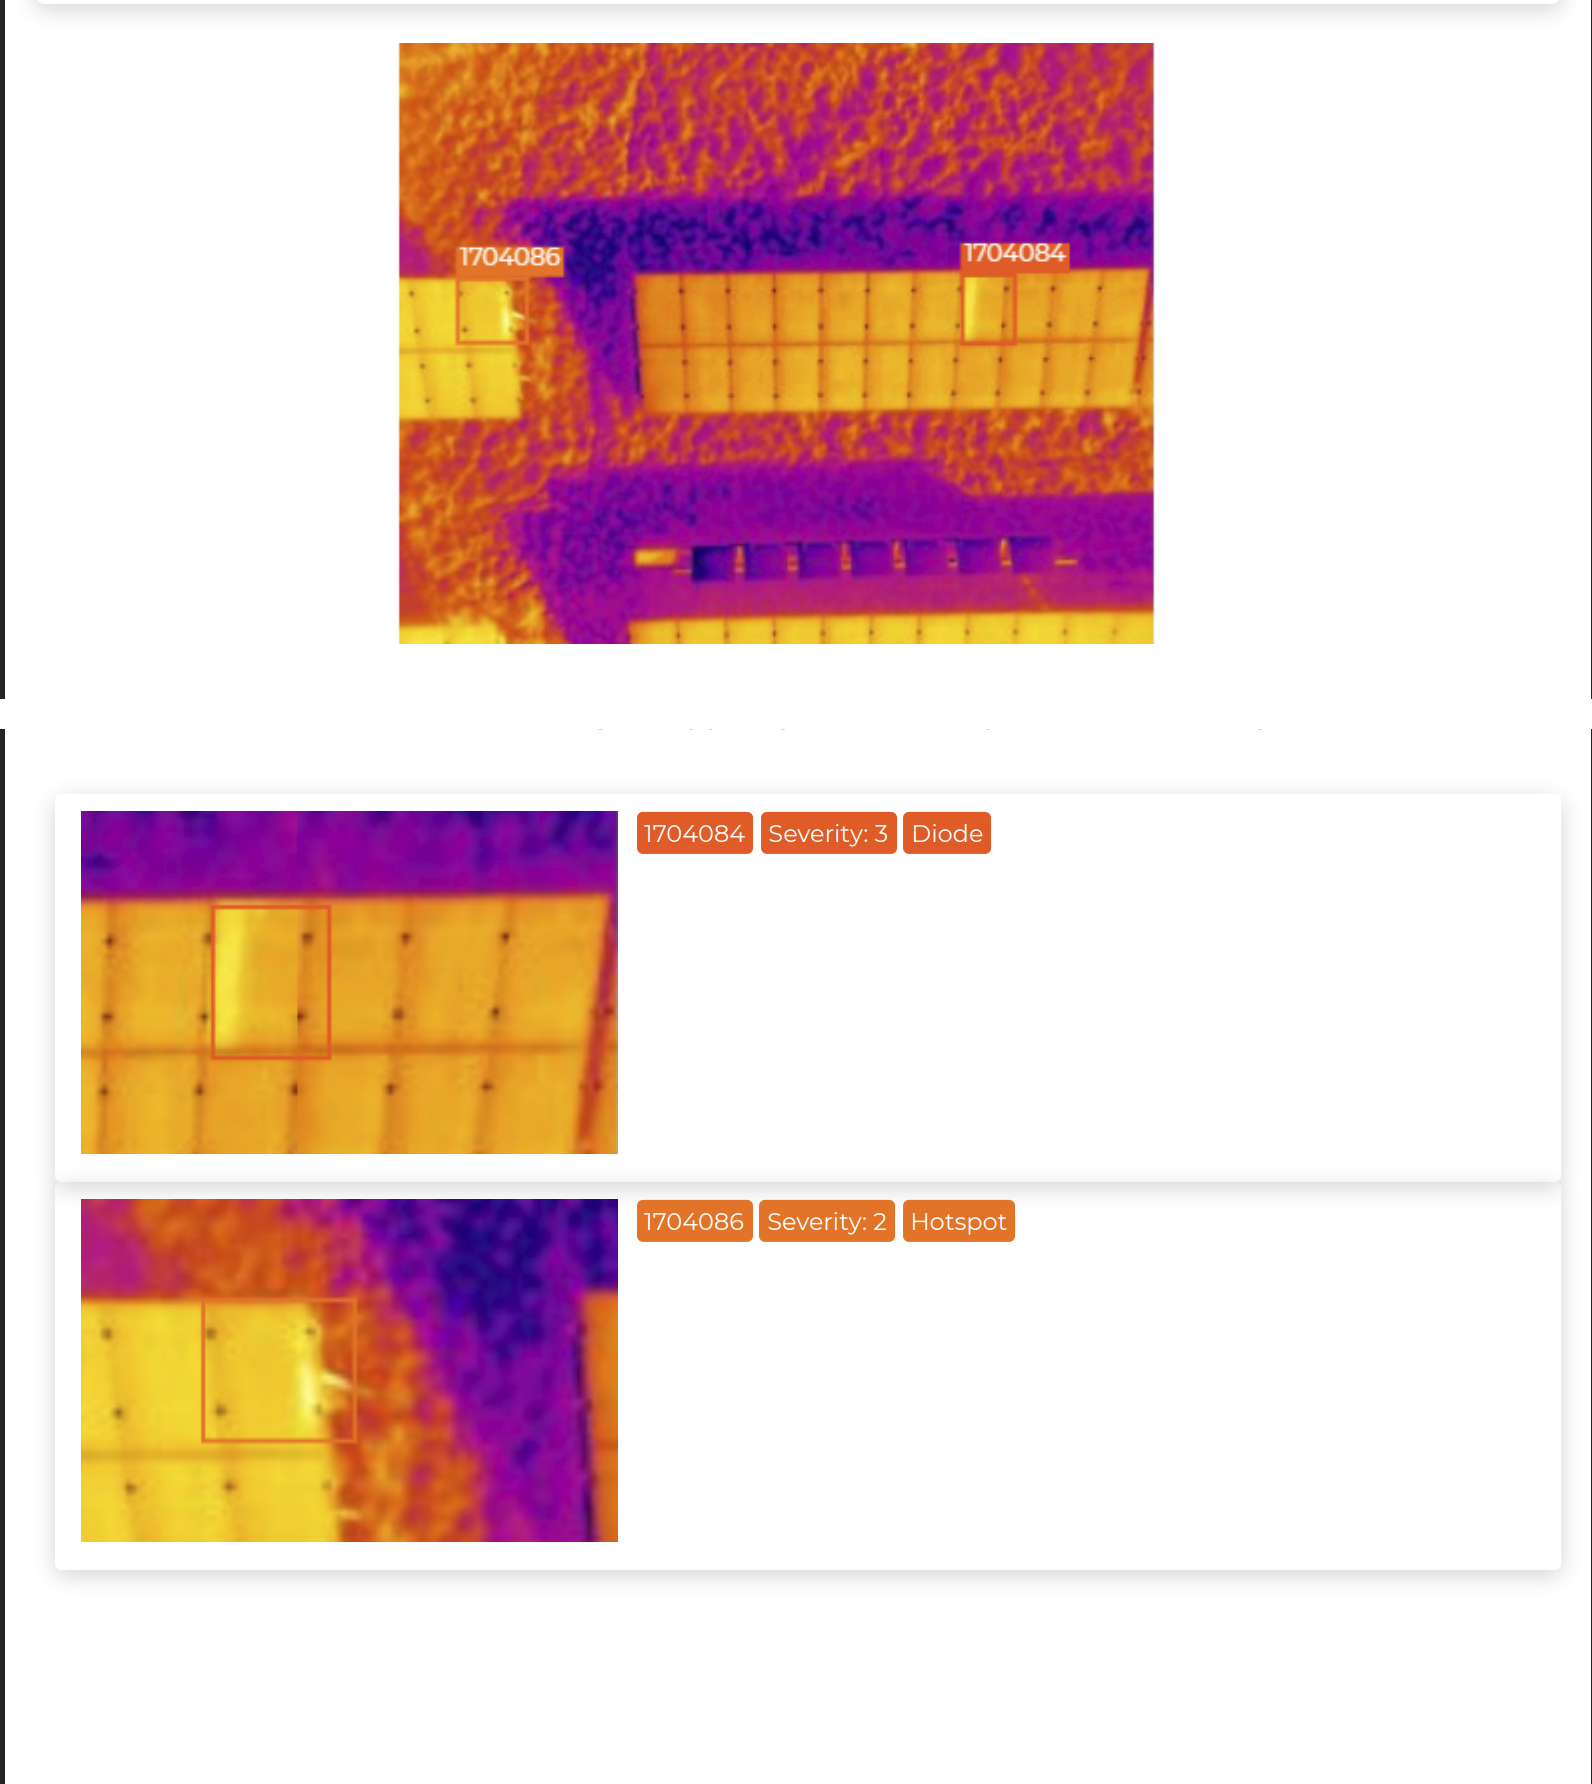 Sev 2 · Hotspot
Cell hotspot flagged alongside diode activity
Want a sample report for your fleet?
Blue UAS Cleared aircraft · American-made platform · mobile field deployment
Explore Other Industries MIR Serves
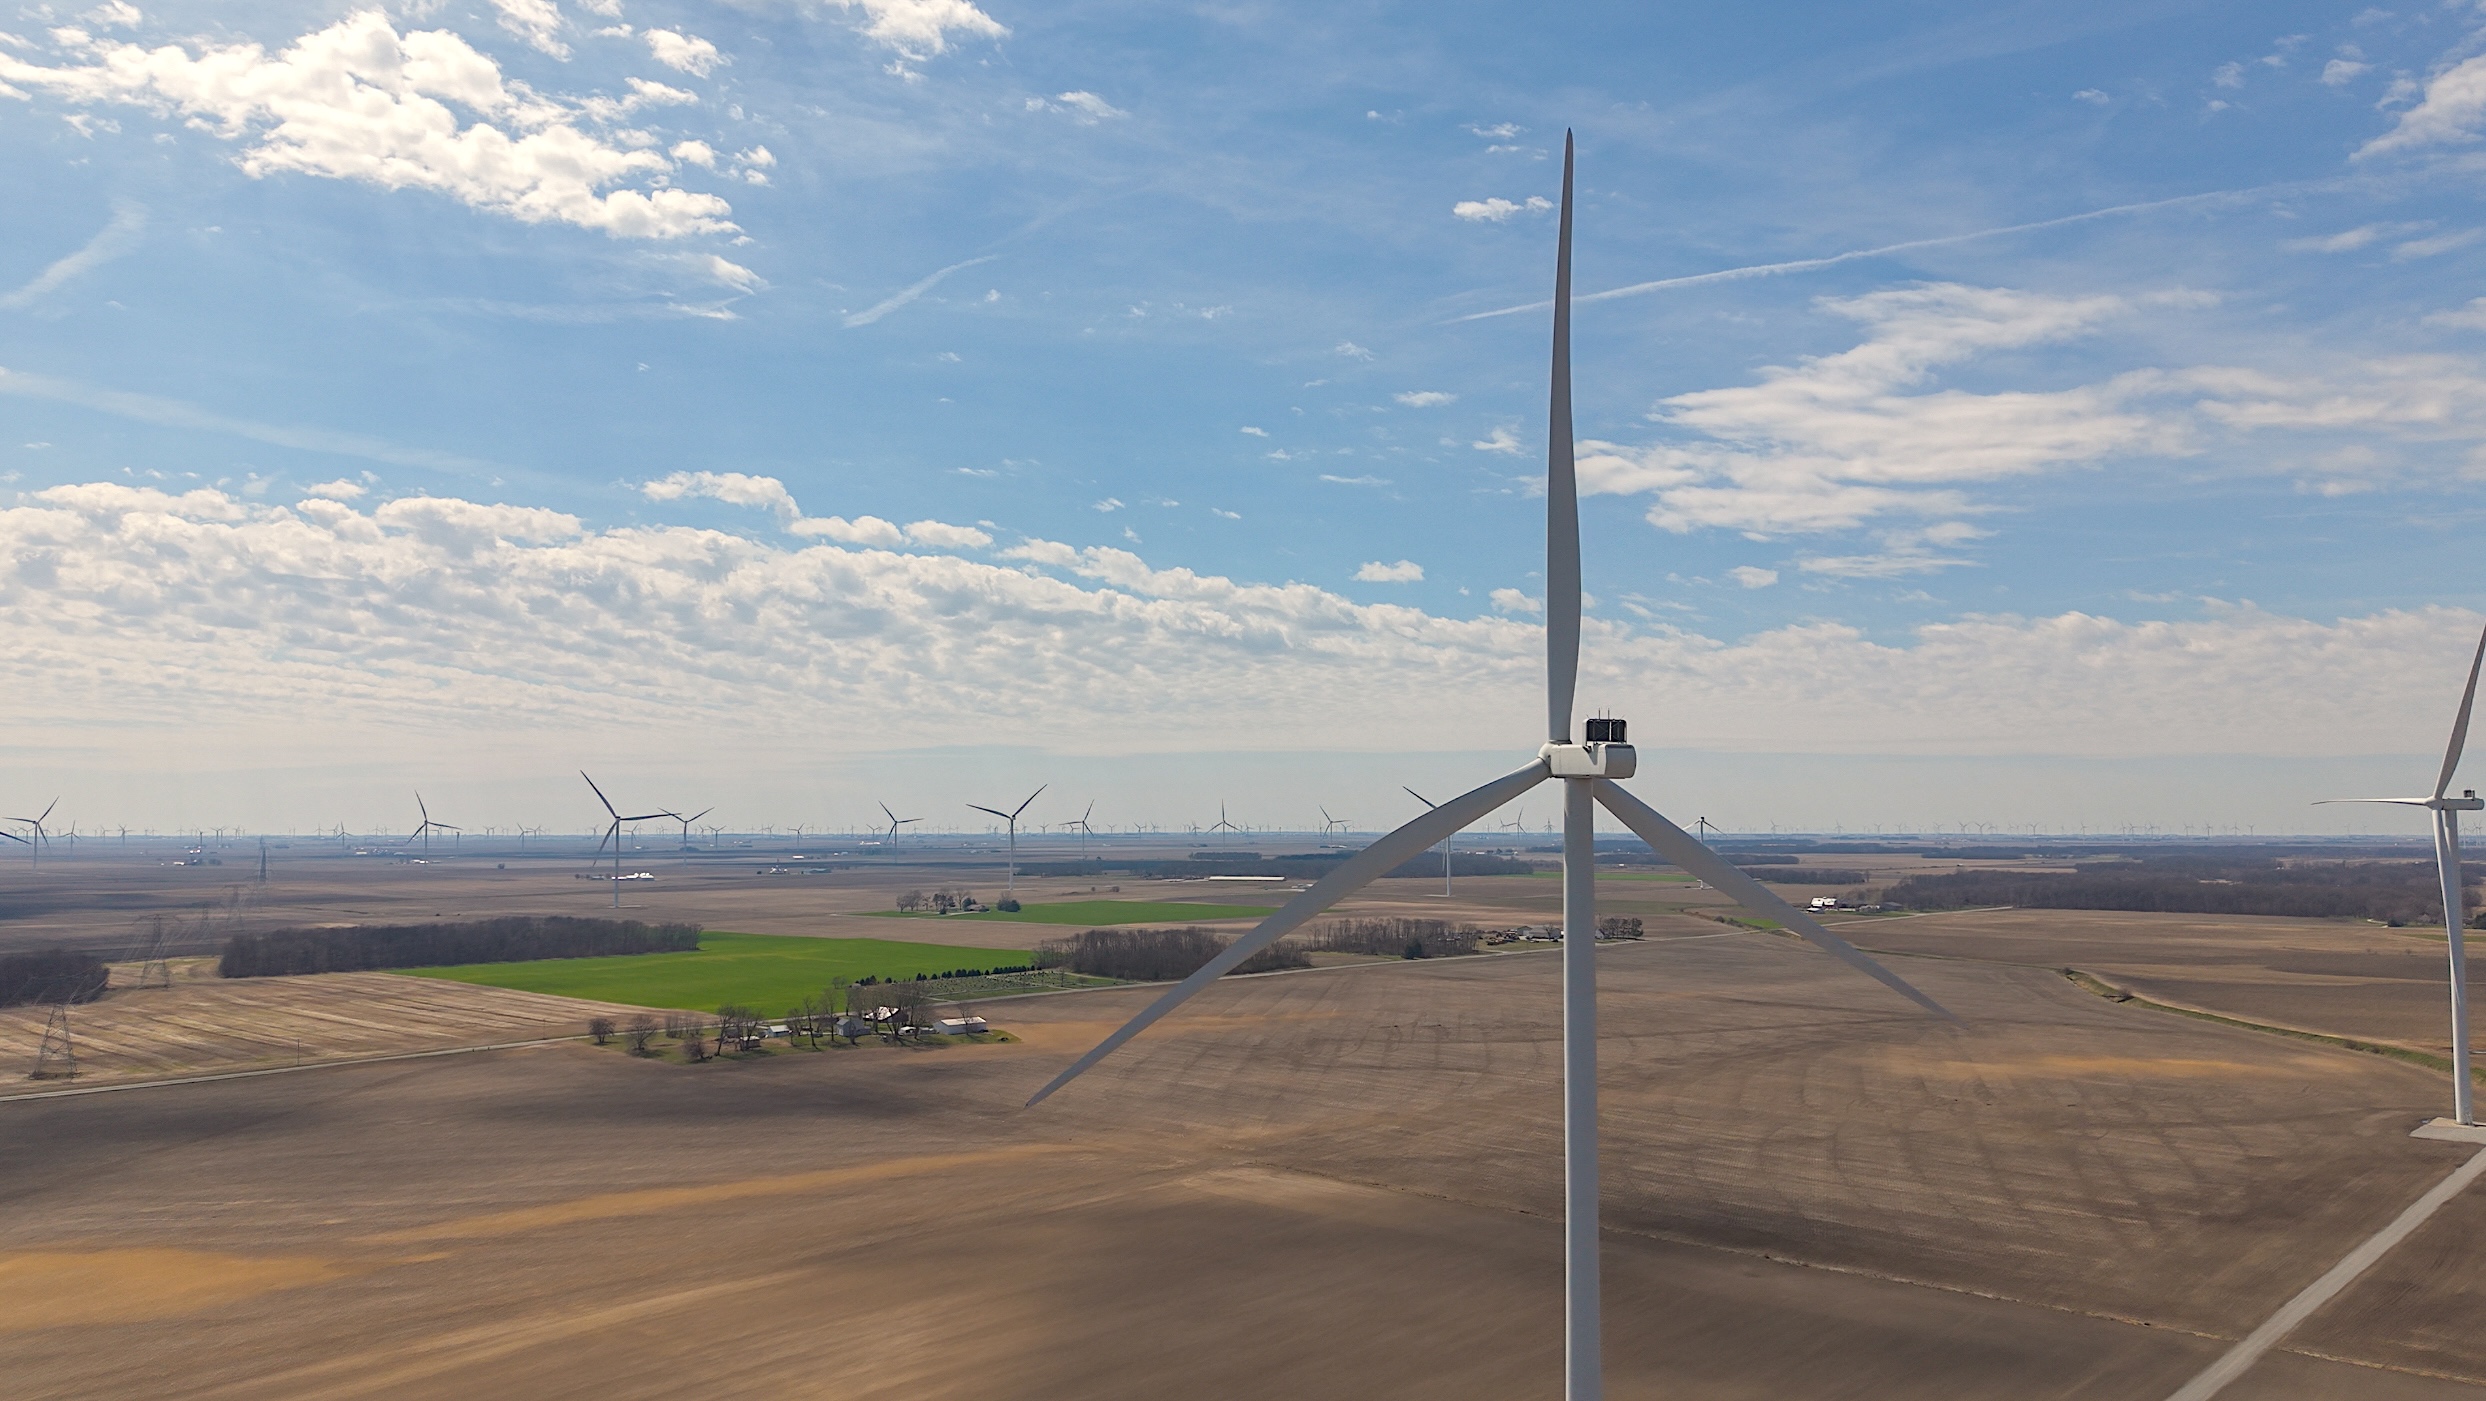
Wind Energy
Wind inspection data collection and vendor support — blade, tower, and nacelle records that pinpoint leading-edge erosion and serial defects without prolonged downtime.
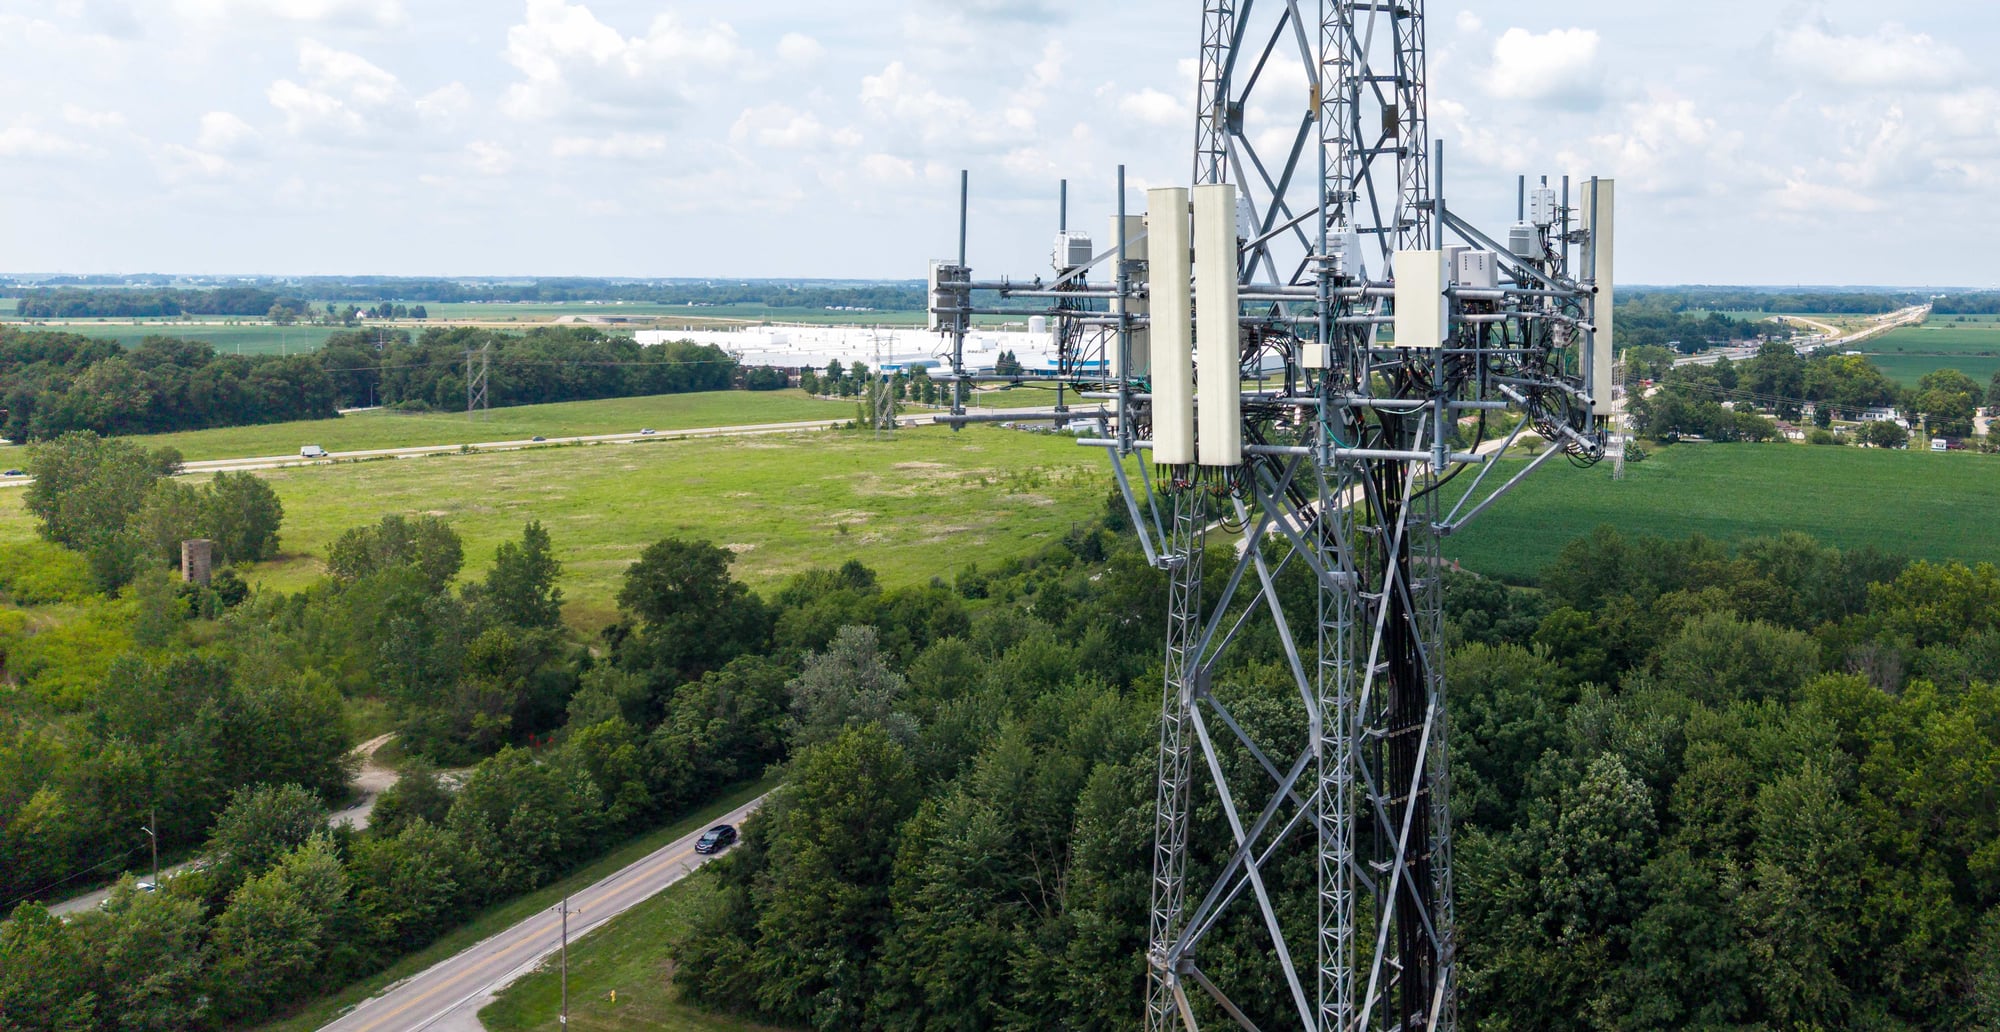
Telecom
Cell-site audits, structural documentation, and measurable digital twins that support colocation and close-out.
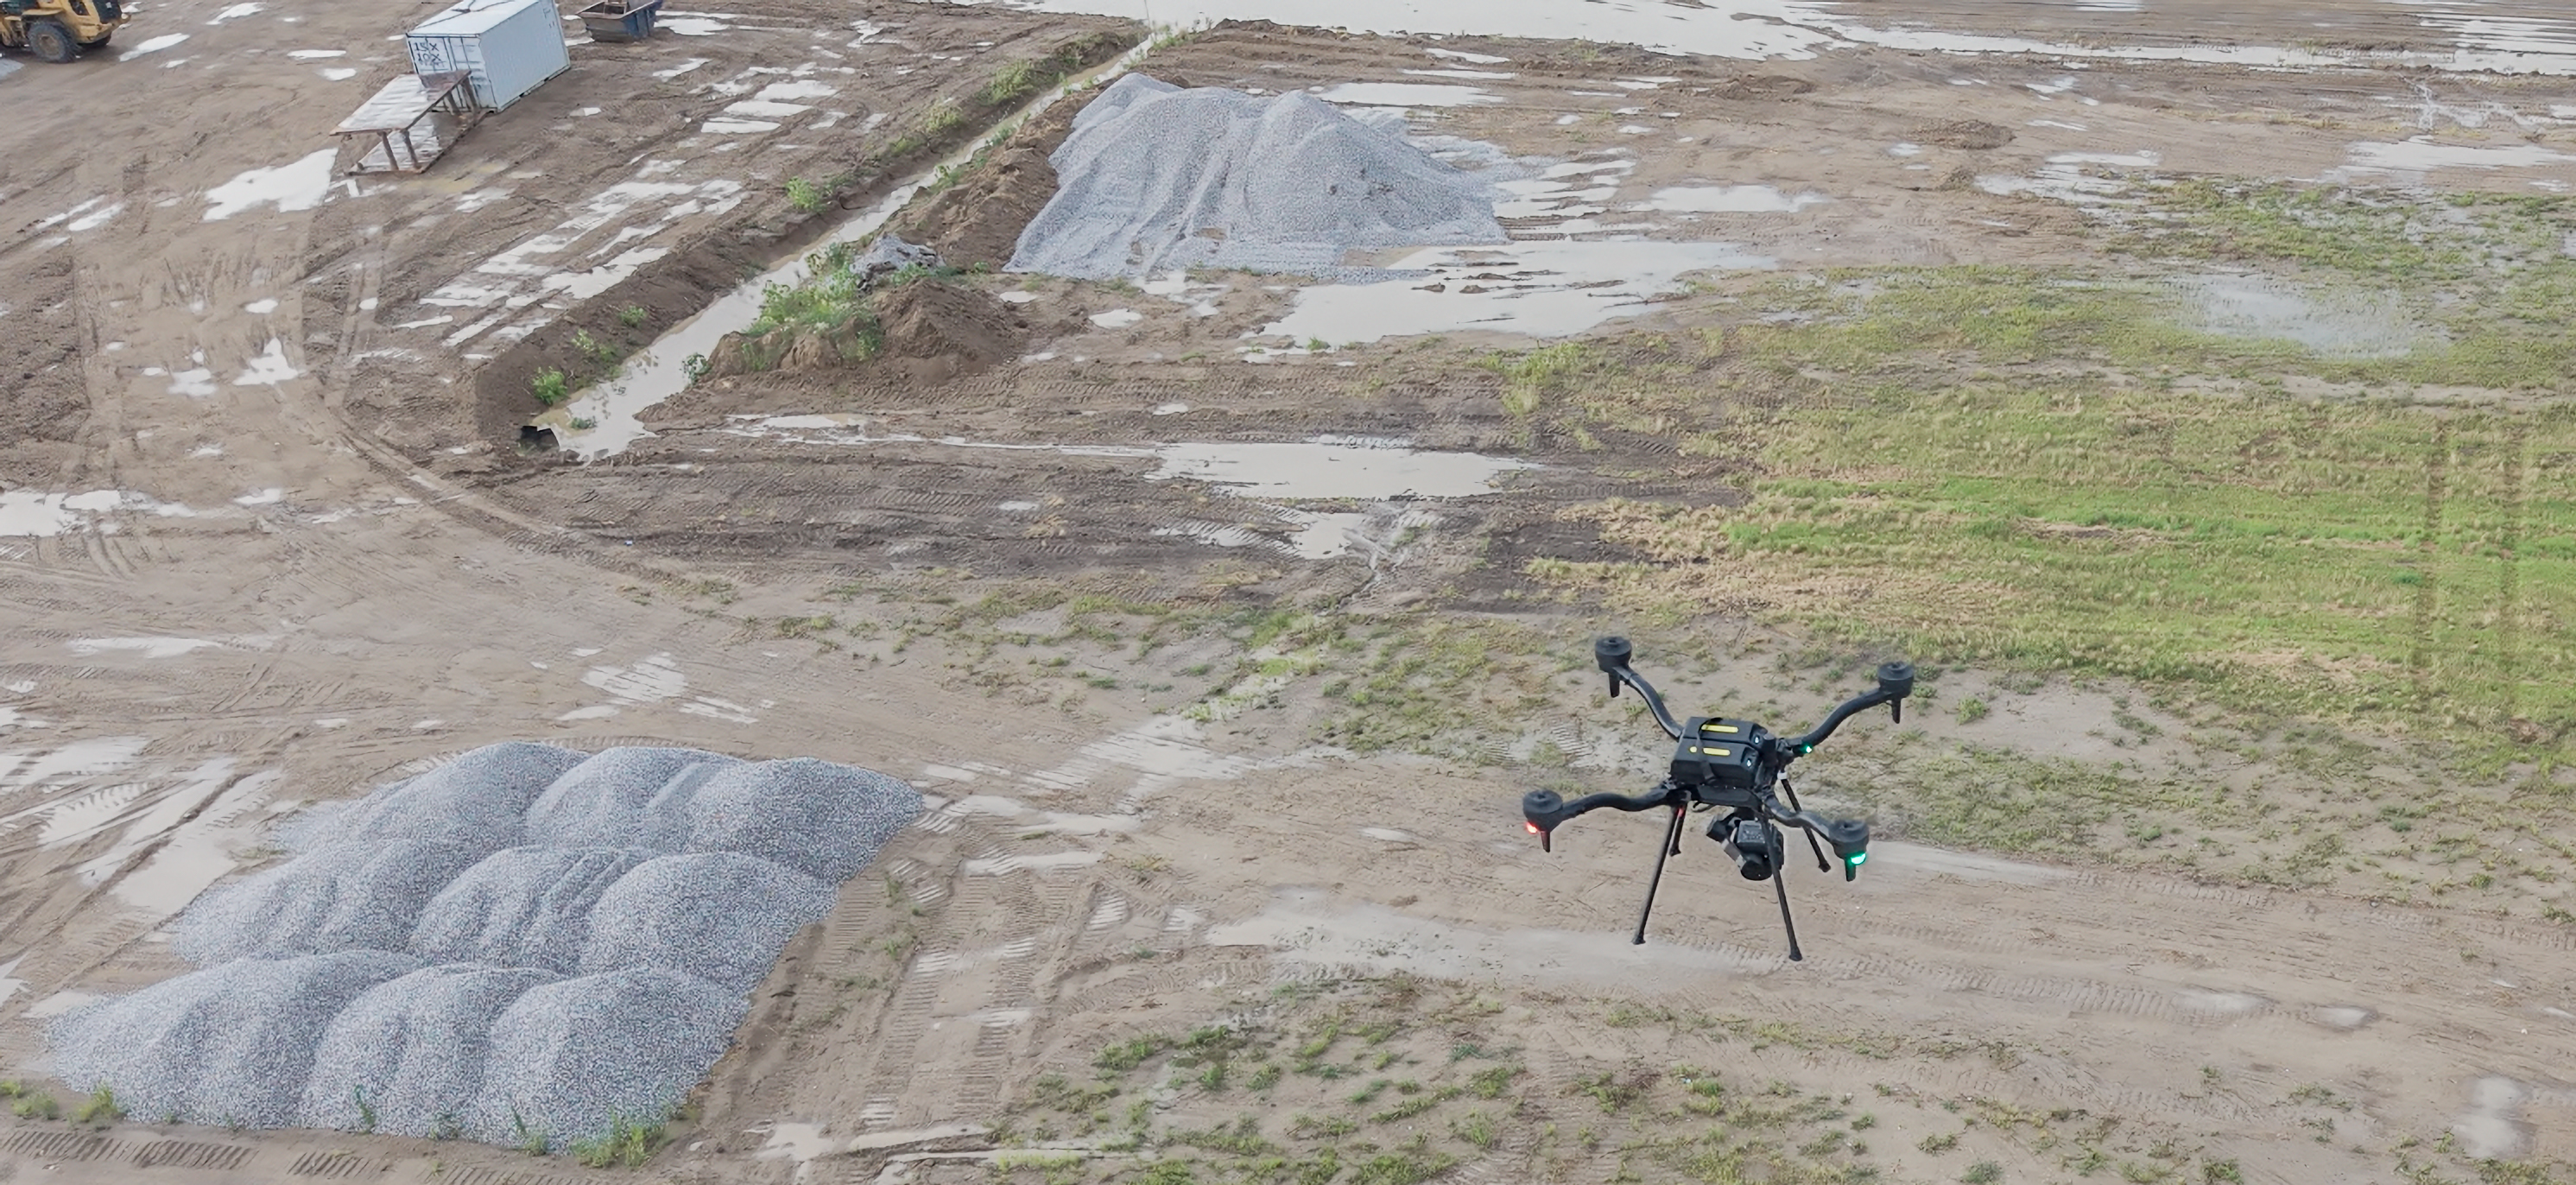
Mining & Aggregates
RTK-referenced stockpile volumetrics, pit-progression models, and highwall documentation — captured with high-accuracy photogrammetry and LiDAR, without entering hazardous zones.
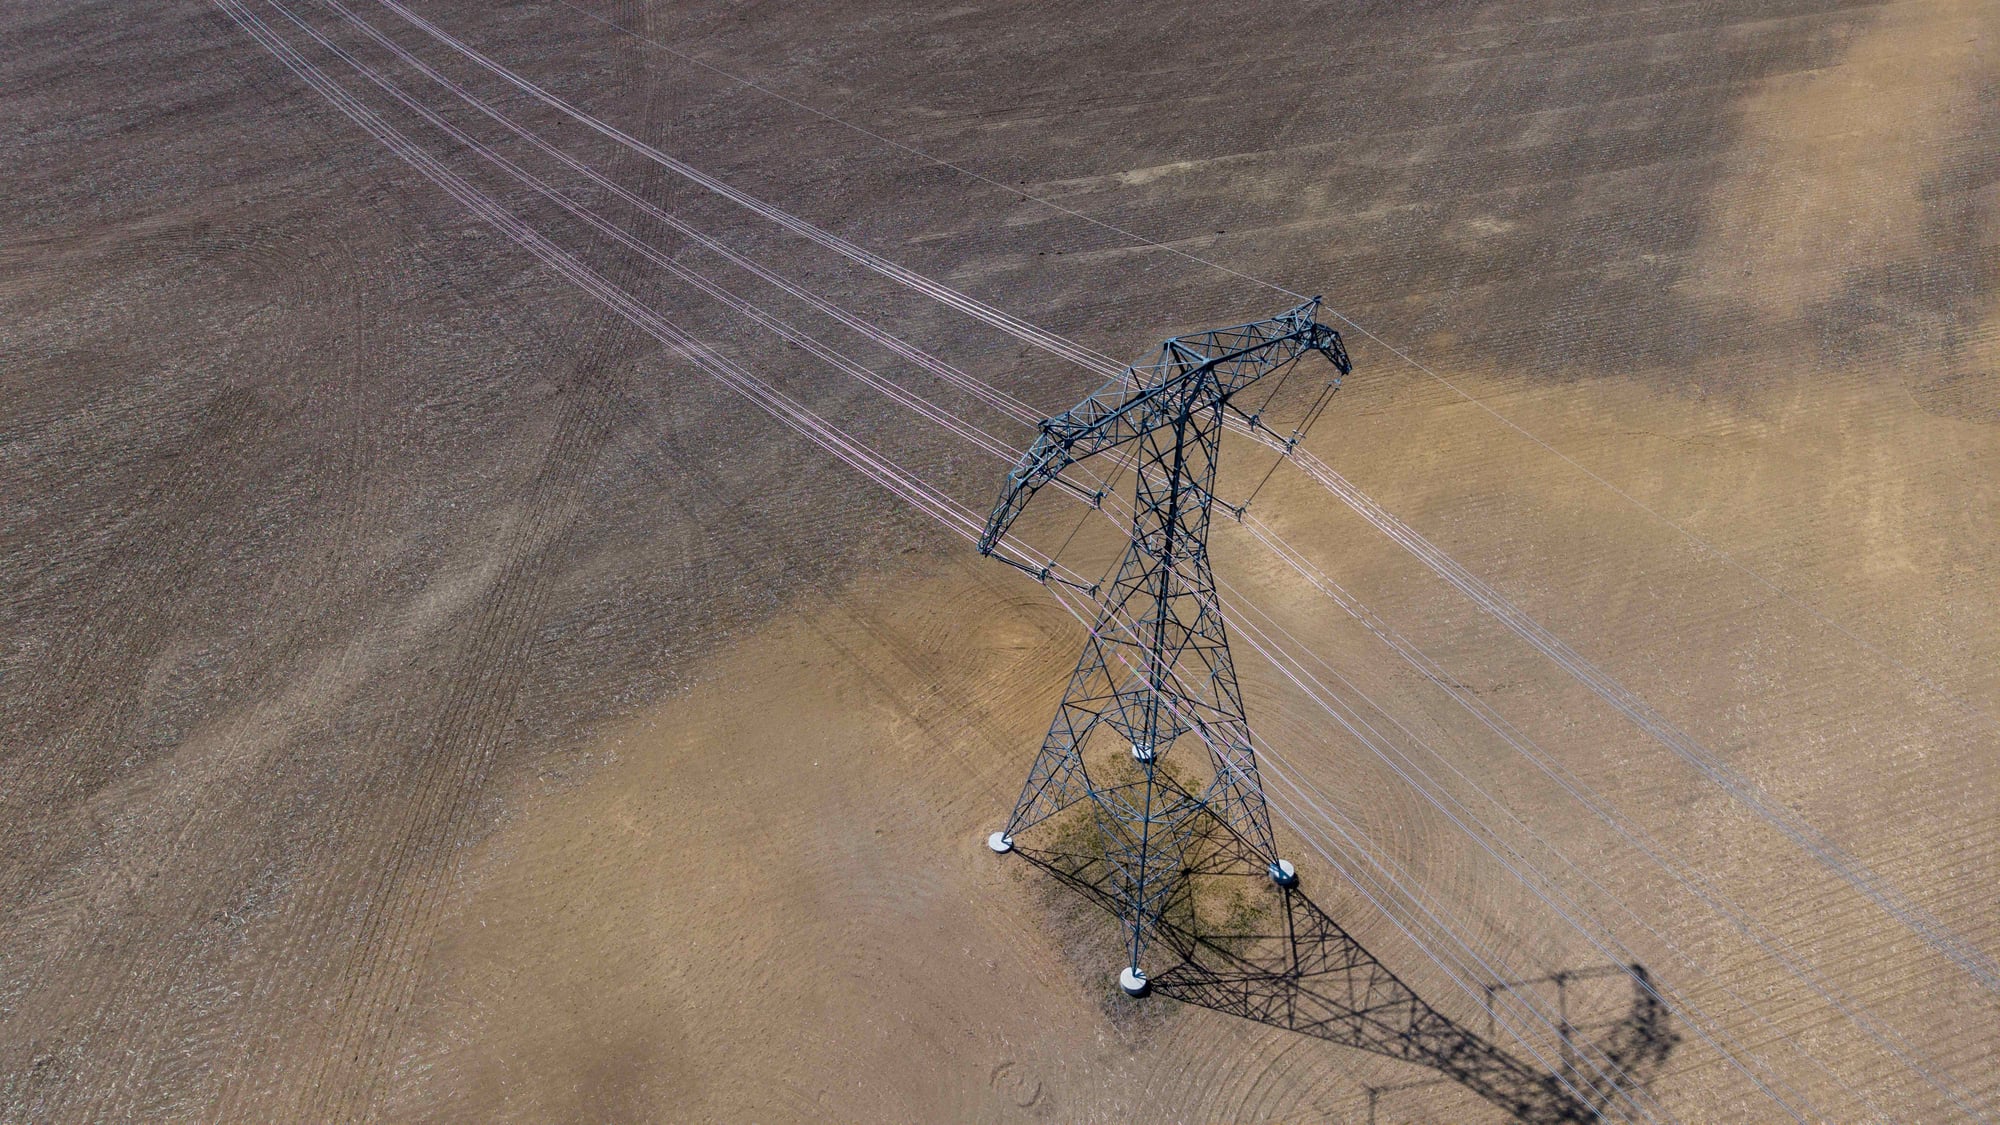
Utilities & ROW
T&D structure inspection, LiDAR corridor mapping, and vegetation-encroachment documentation for reliability and compliance.
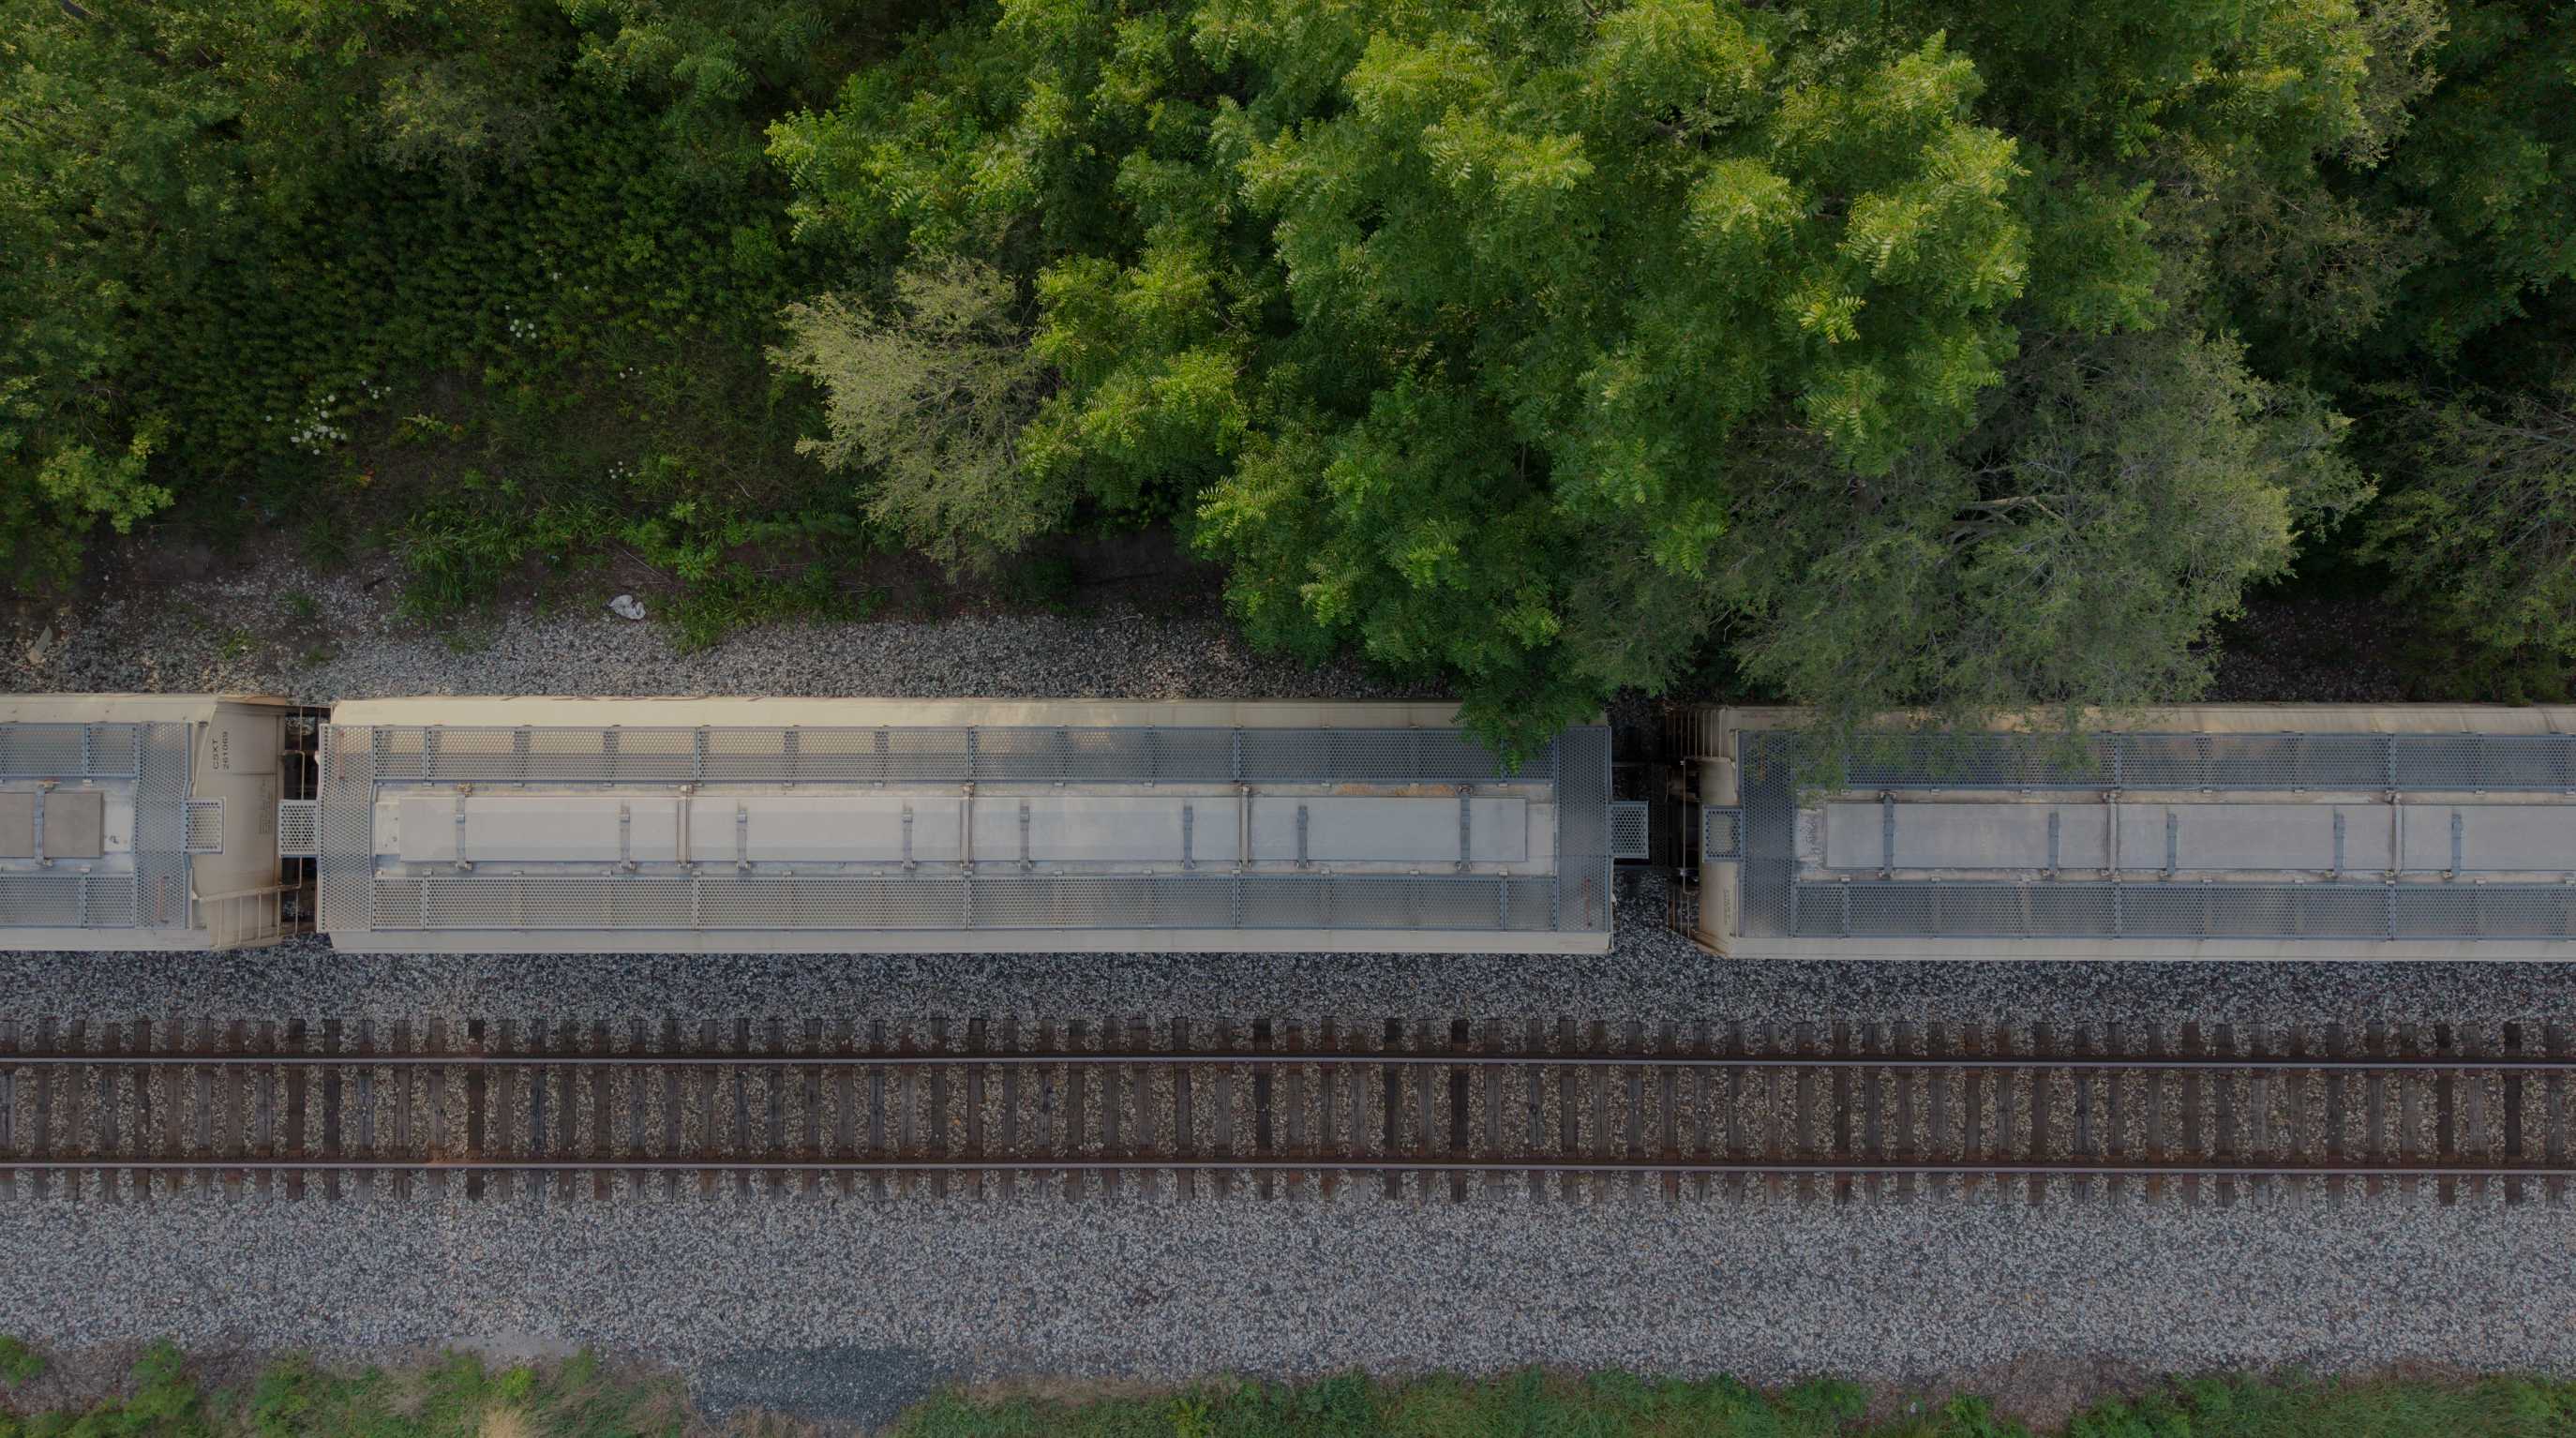
Rail & Transportation
RGB corridor mapping and LiDAR data along rail corridors — reducing time spent on or near live track.
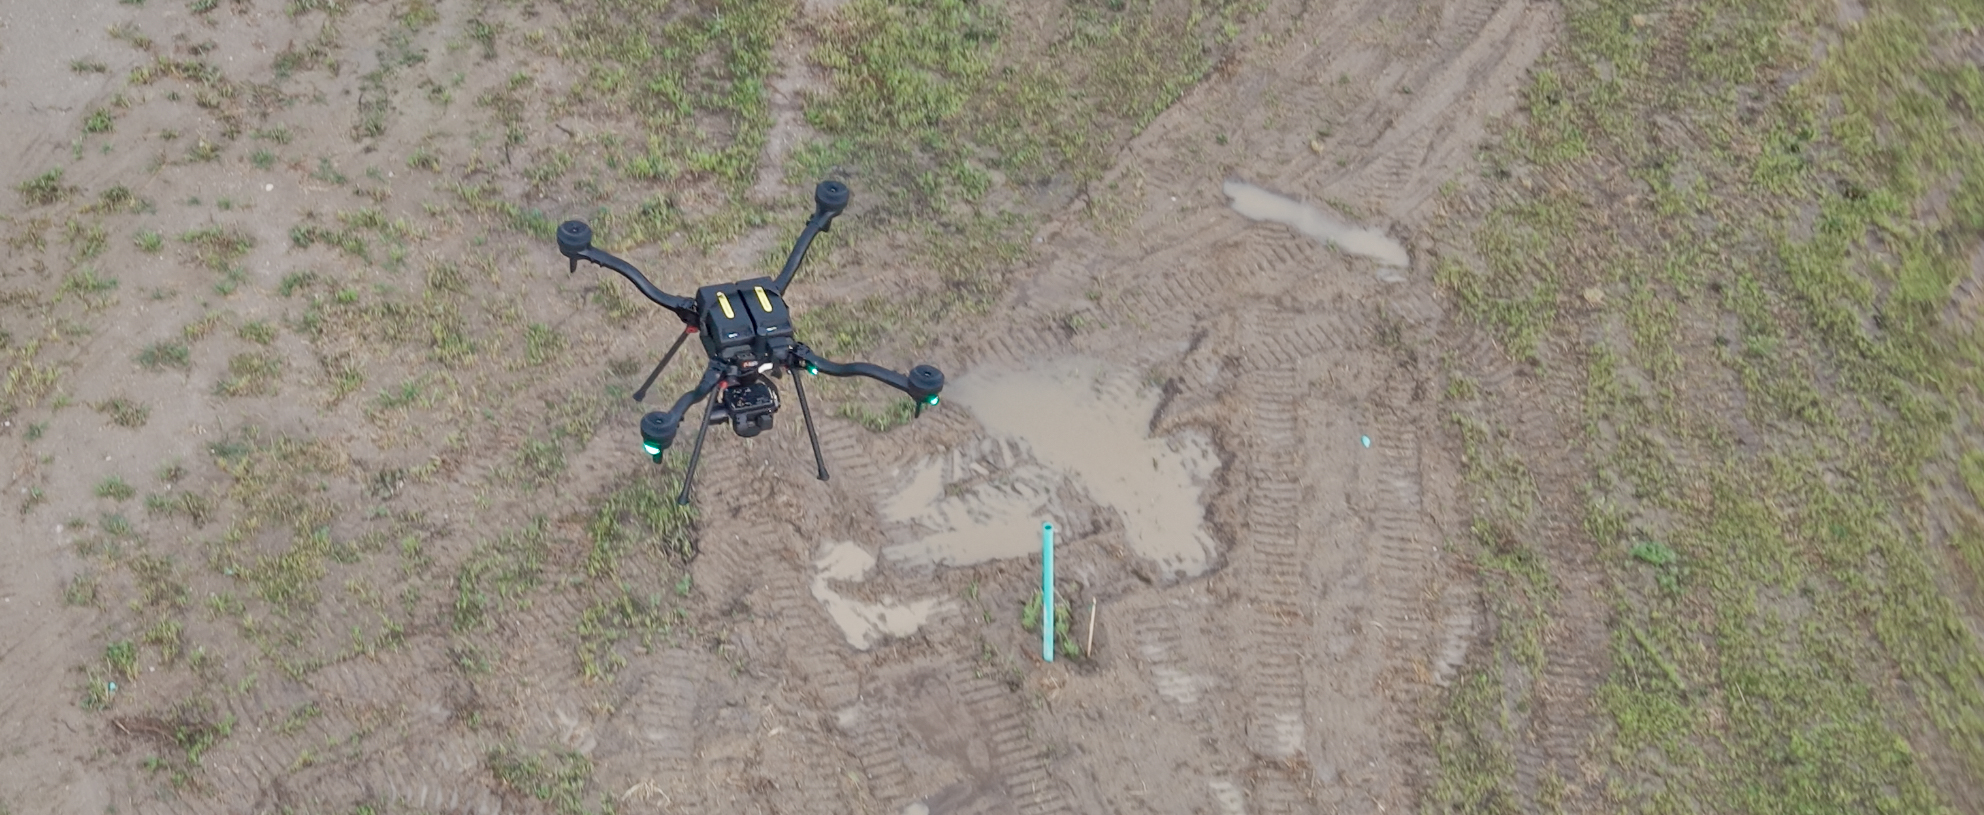
Civil & Geospatial Support
RTK-enabled aerial LiDAR and 61MP RGB collection — orthomosaics, point clouds, terrain surfaces, and construction documentation to support licensed survey teams, civil engineers, developers, and contractors.
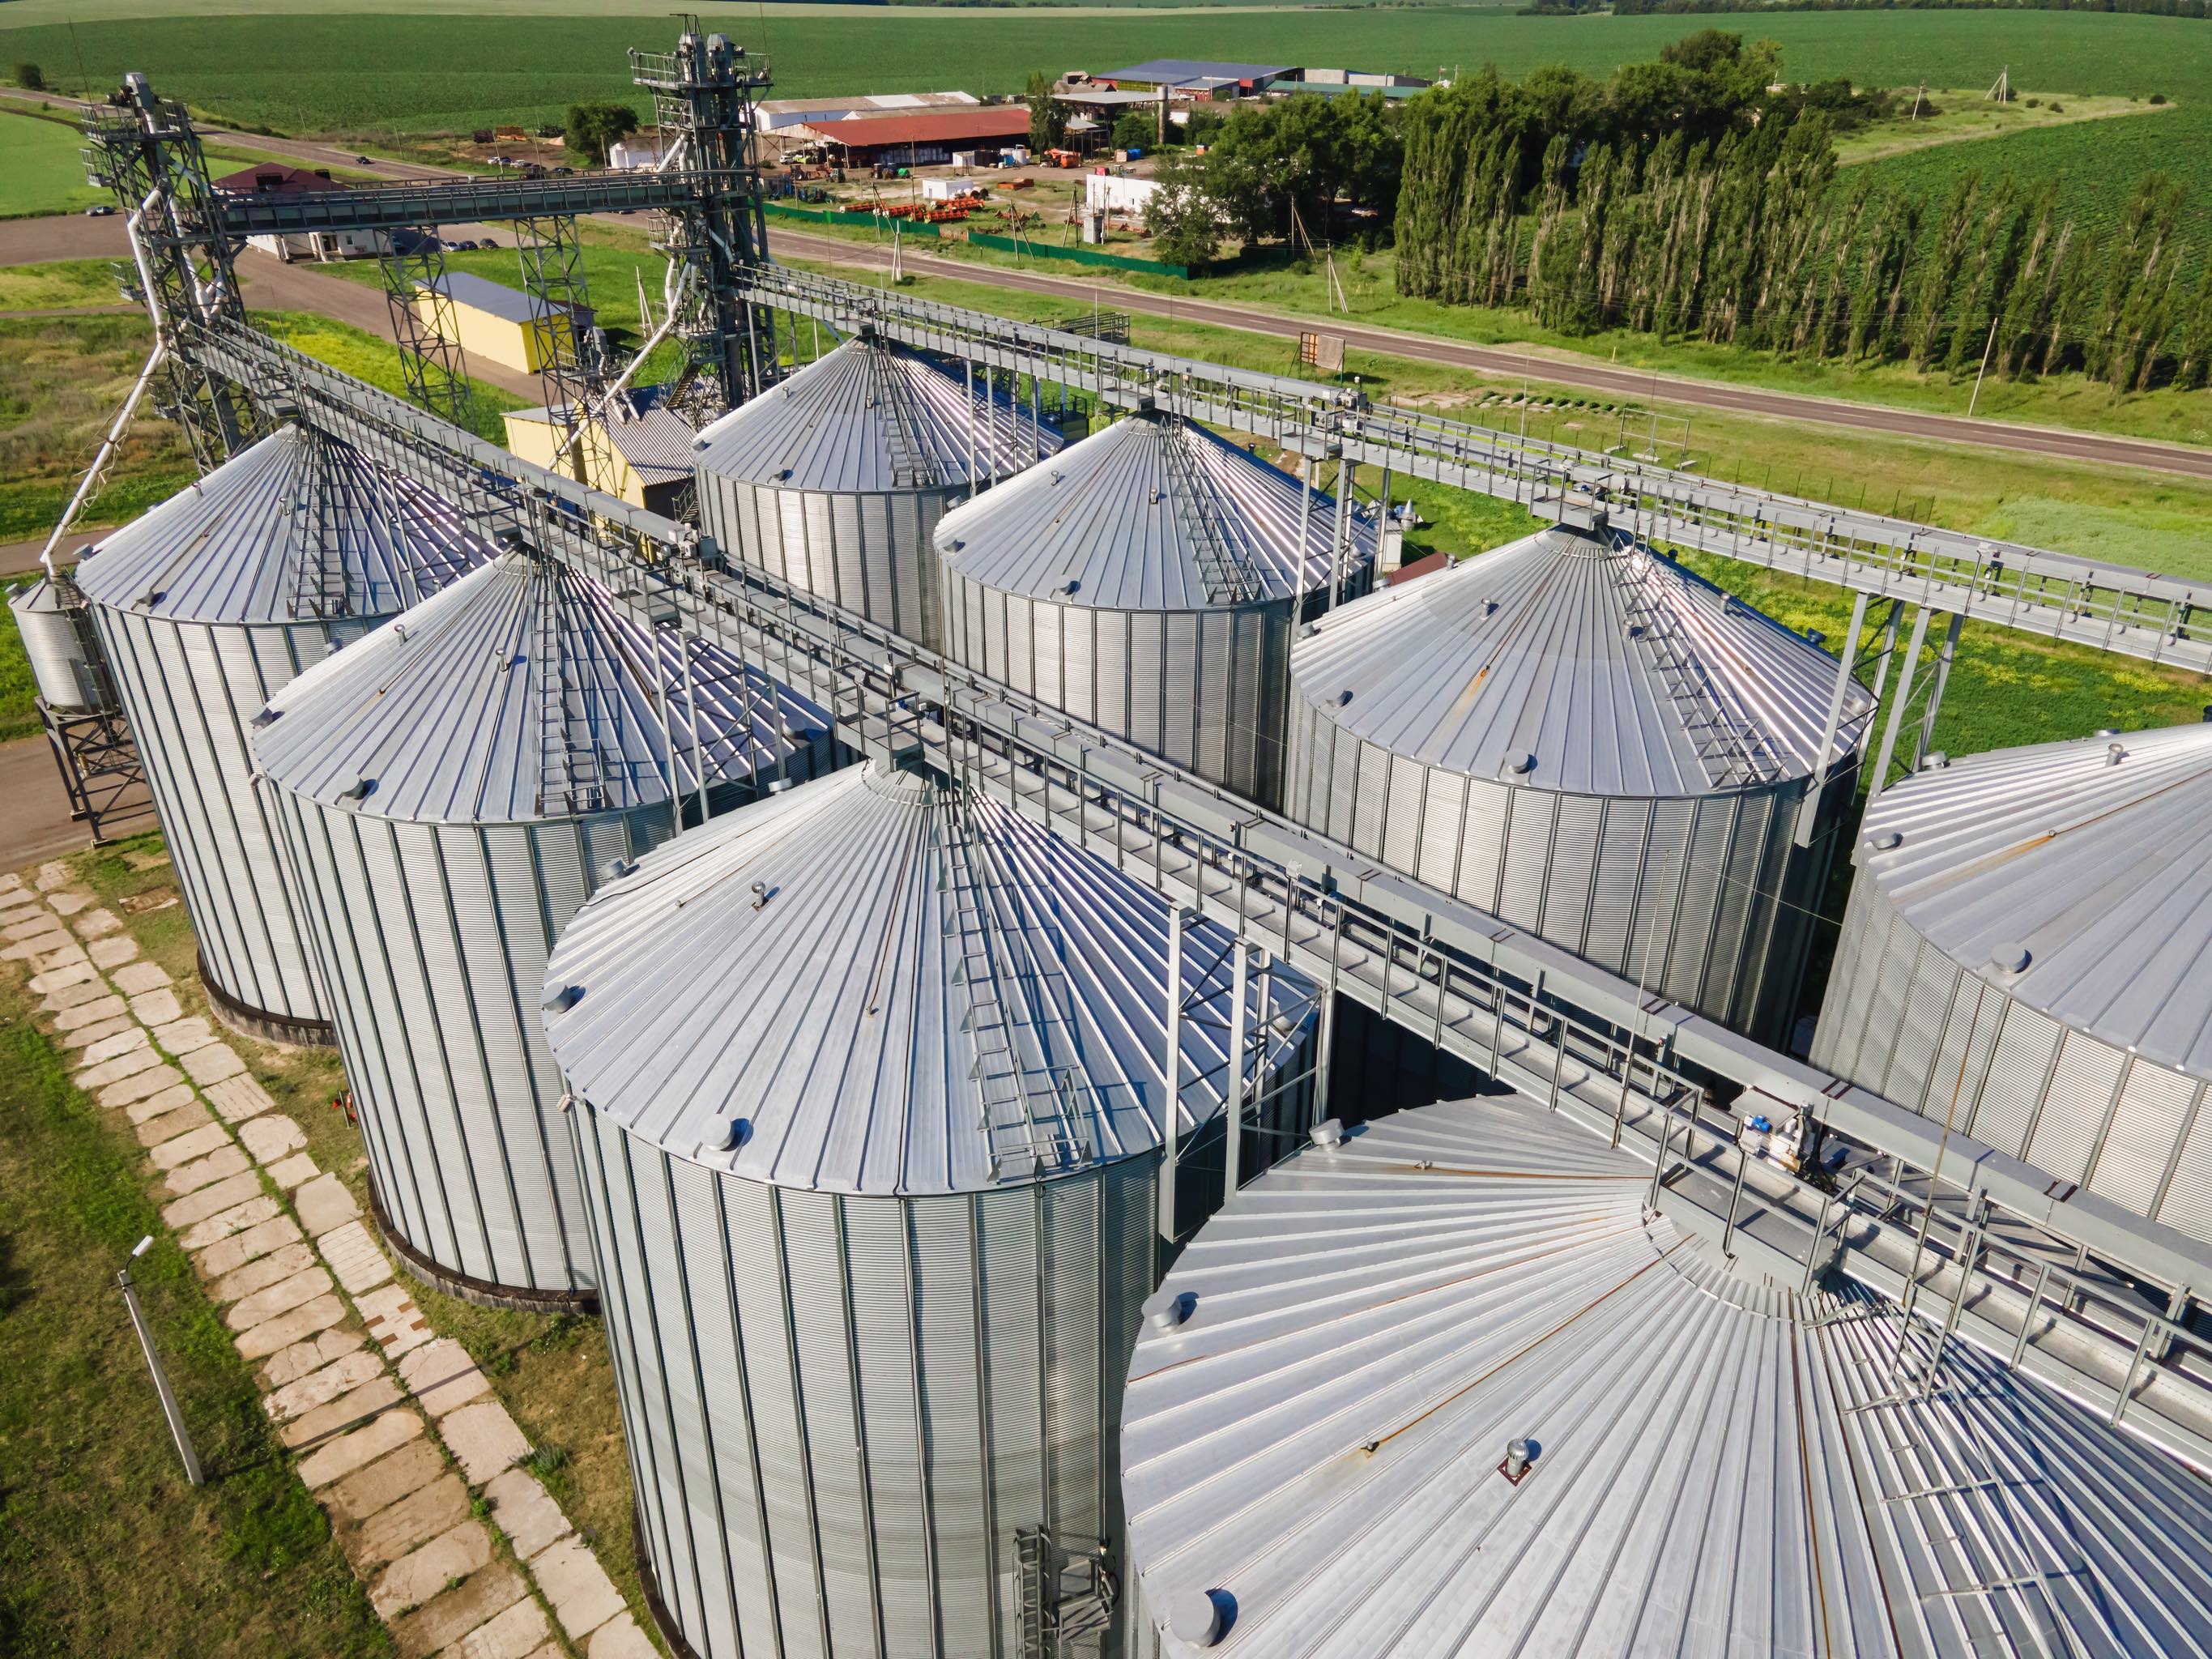
Grain Storage & Handling
Exterior condition documentation, thermal risk screening, and RTK-referenced quantity data for concrete silos, steel grain bins, elevator structures, handling equipment, and visible open storage.
Start With the Project Objective
Have a Solar & Renewables Project?
Tell us what needs to be inspected, mapped, measured, or documented. We'll help determine the right collection method, payload, mission structure, and deliverables.