

Wind Energy
Wind inspection data collection and vendor support for owners, O&M teams, and inspection programs. MIR flies blade, tower, and nacelle missions and turns them into severity-graded, turbine-by-turbine Scopito records — for approved-vendor work, overflow data collection, storm-response documentation, and warranty and maintenance history.

Blue UAS Cleared
Freefly Astro aircraft listed within the Blue UAS framework for procurement-sensitive missions.

$5M Aviation Liability
Coverage built for infrastructure field operations.
Redundant Aircraft
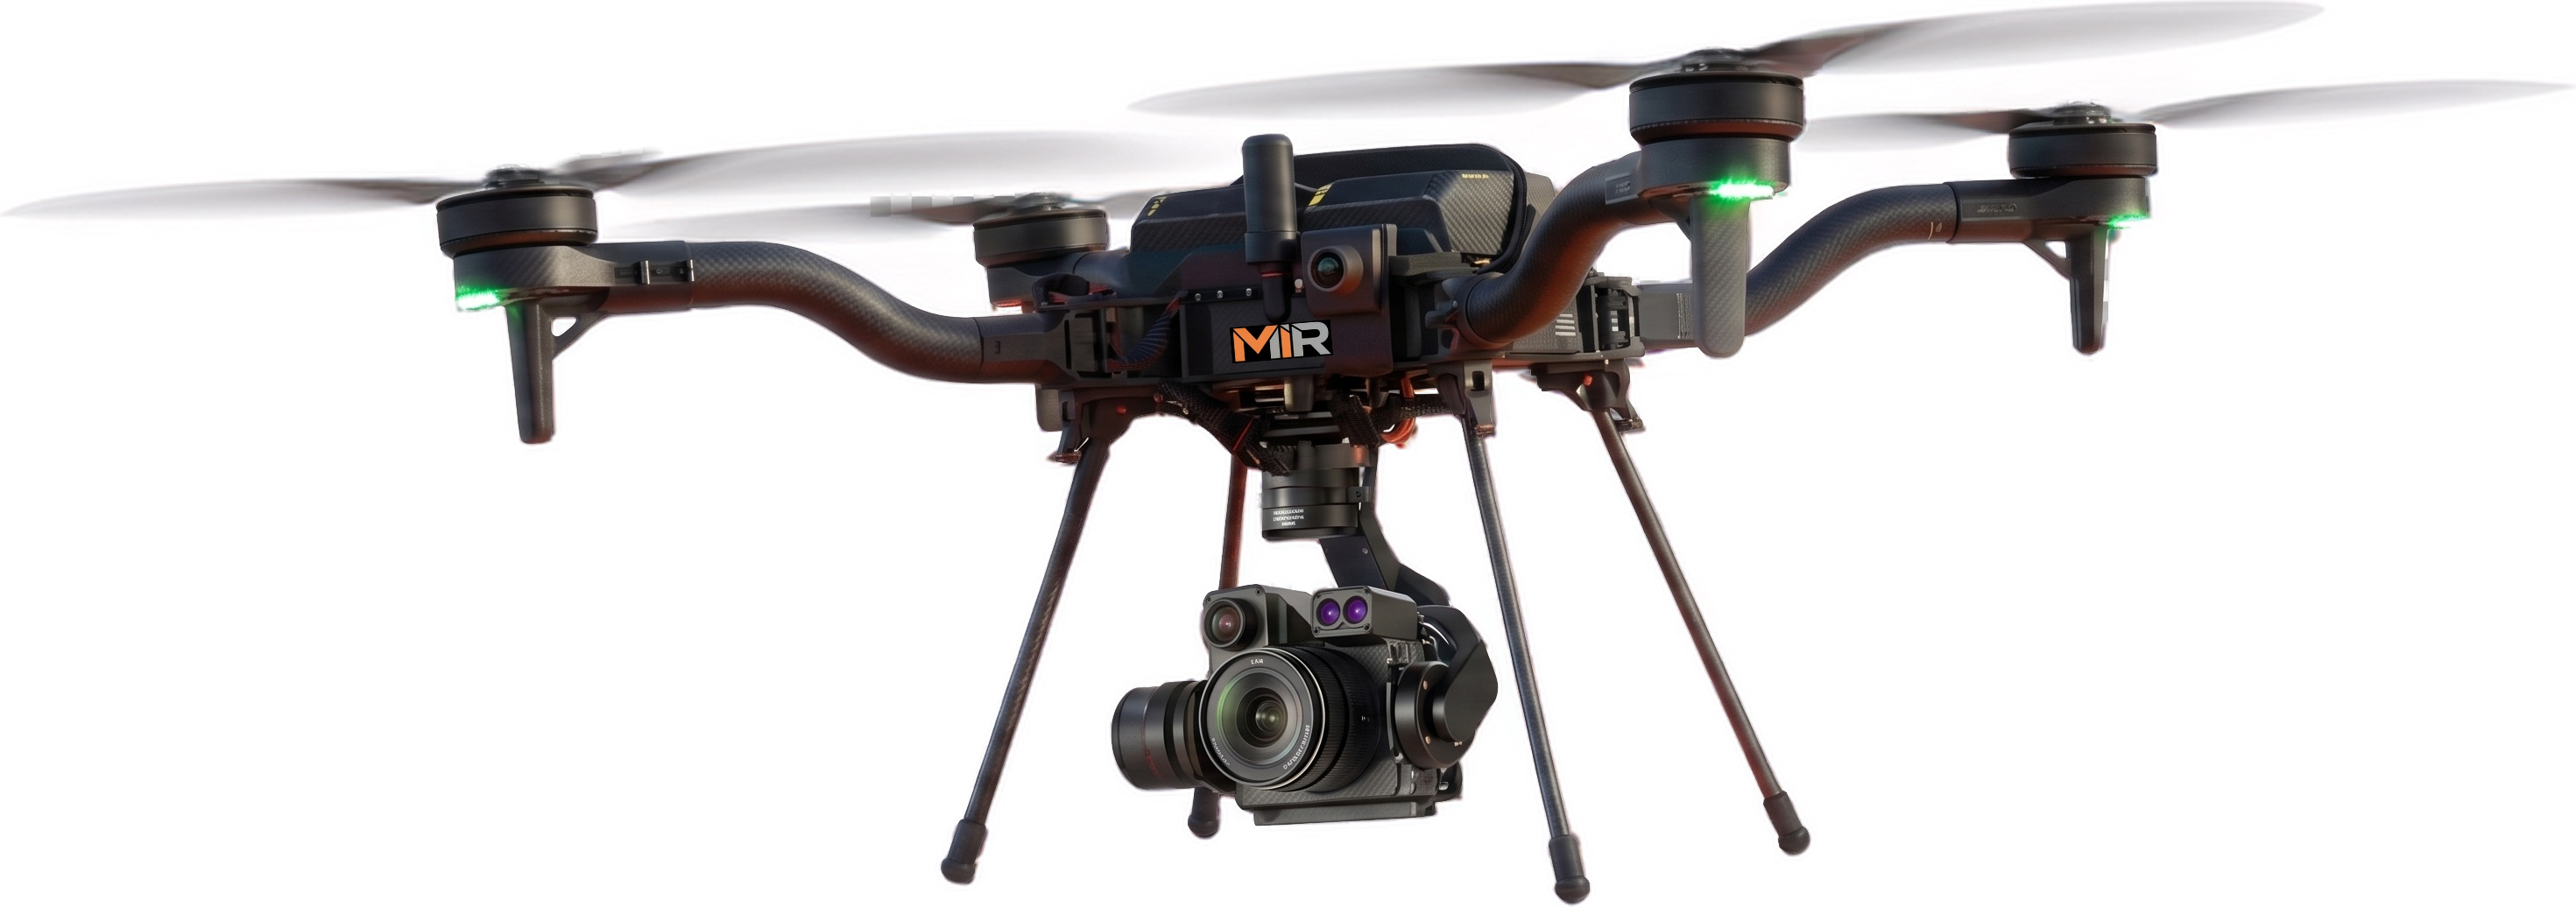
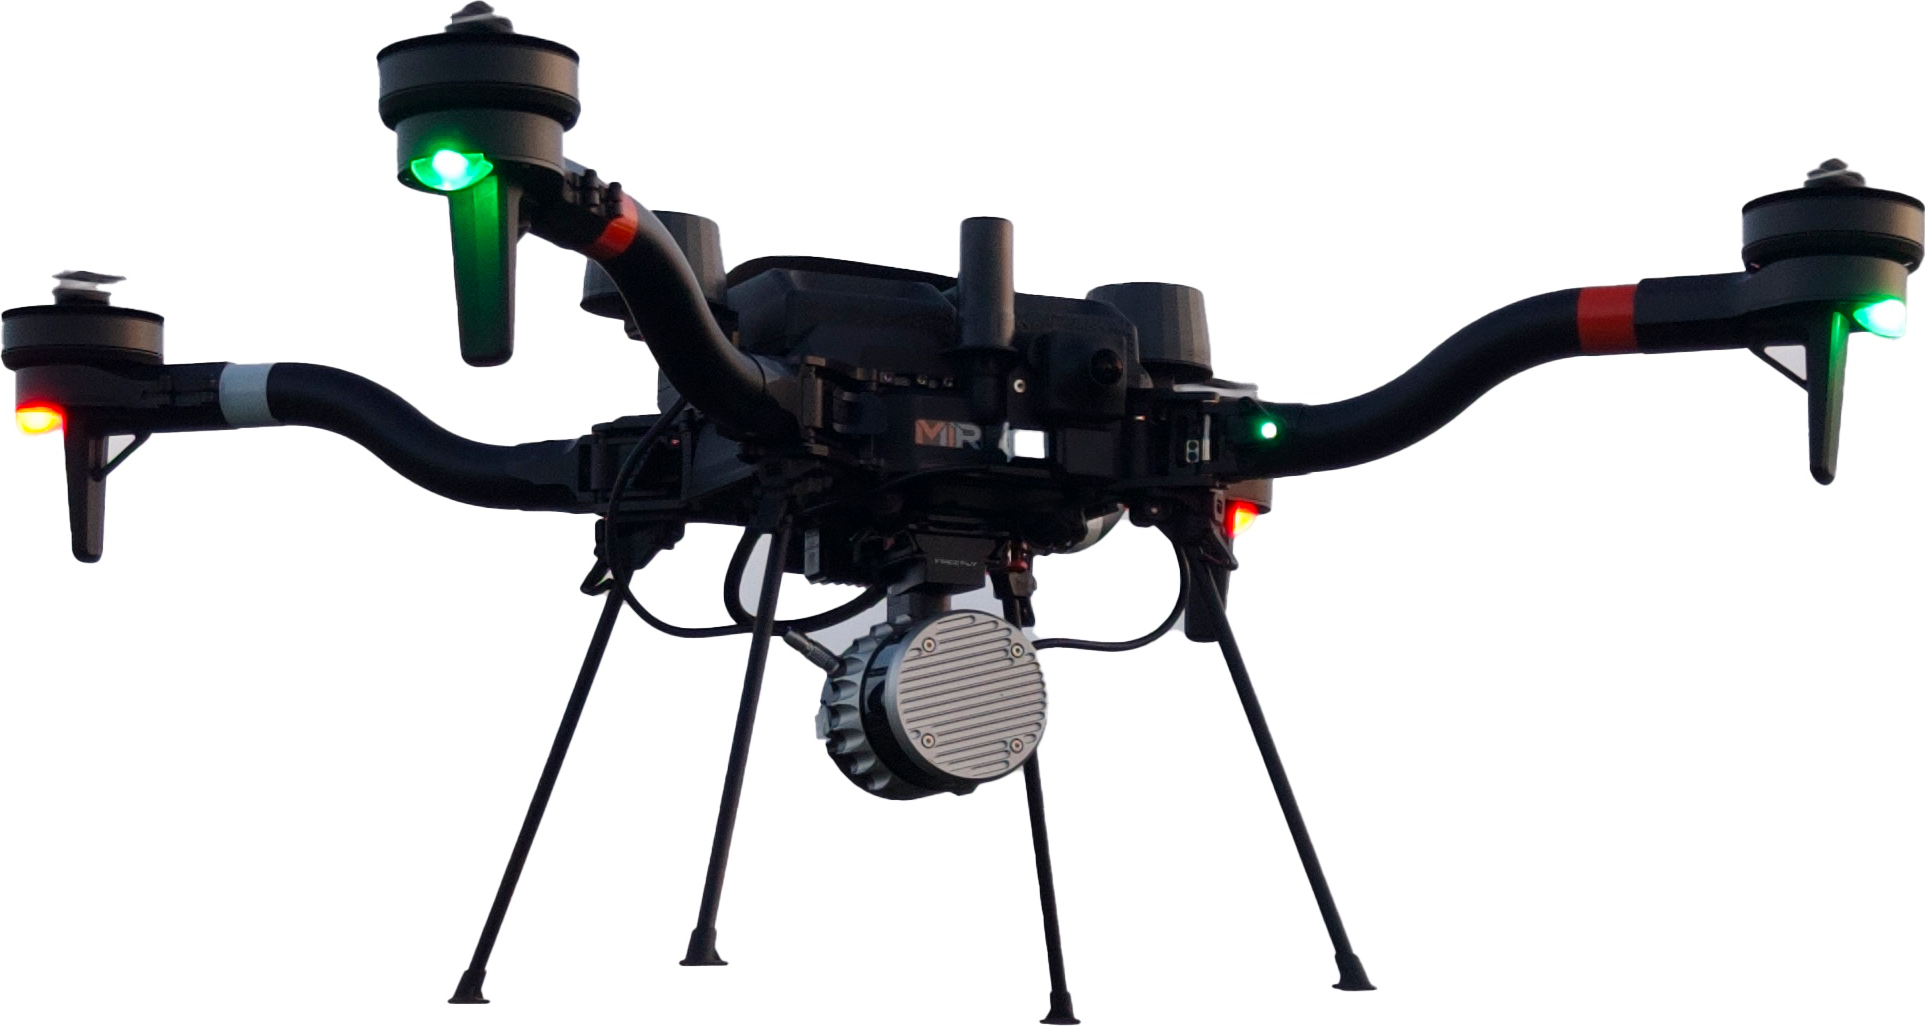
Dual American-made Freefly Astro platforms with RGB and LiDAR payloads for mission continuity.

Mobile Field Support
Charging, live viewing, and data review for sustained operations.
Purpose-Built Data for Wind Energy
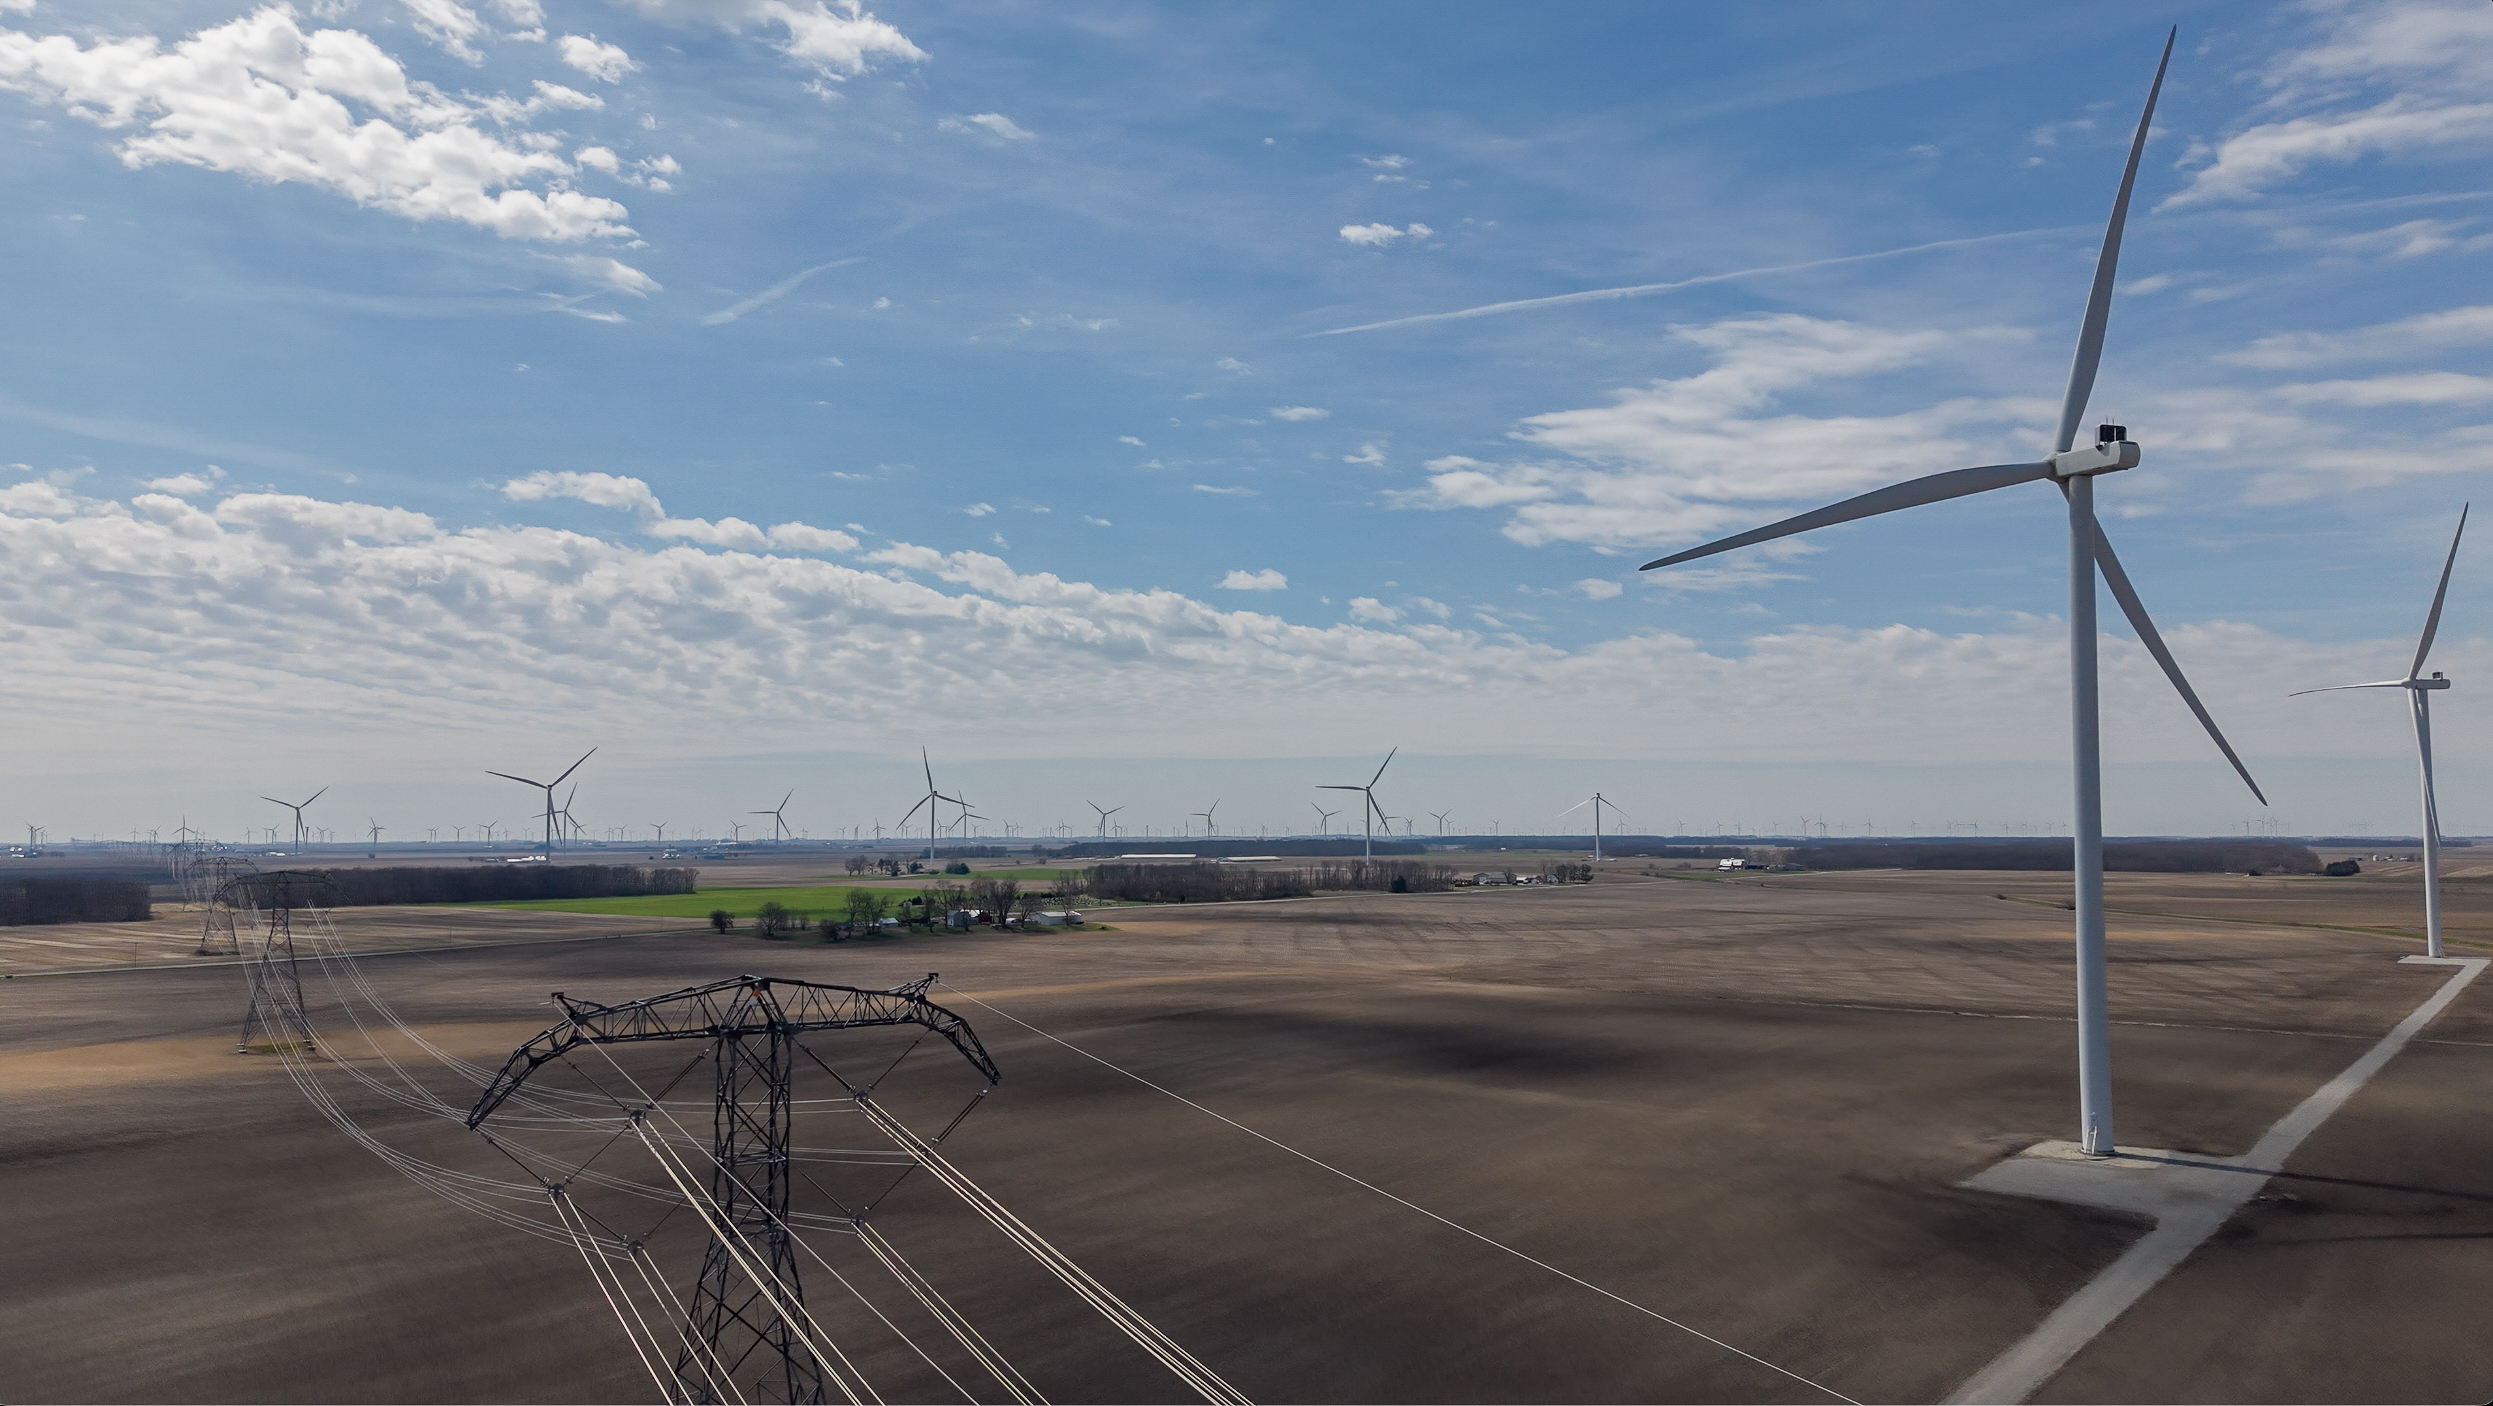
Wind assets are tall, remote, and expensive to curtail. MIR flies structured blade and structure missions that capture high-resolution and radiometric thermal imagery across every blade surface, the tower, and the nacelle exterior. Every image is analyzed in Scopito — using its AI fault detection and independent Blade Experts review — where findings are graded by severity and mapped to the exact blade, side, and radial station on the Live Turbine Diagram. That gives O&M and asset-management teams the detail to triage serial defects, plan rope-access or crane repairs, and hold a defensible warranty and maintenance history — all while keeping turbines out of service no longer than the inspection window requires. MIR supports approved-vendor and inspection-program work, overflow data collection during peak season, and storm and event response — site and operations staff are welcome to route MIR to procurement, asset management, or inspection-program decision-makers for qualification.
From Flight Plan to Work Order
Every wind energy project runs the same repeatable pipeline: missions are planned in UgCS, flown autonomously by AMC (Auterion Mission Control) on American-made Freefly Astro aircraft, then offloaded to the right software — Pix4Dmatic for mapping and photogrammetry, Scopito for inspection findings, and Freefly Flow for in-field LiDAR point clouds.
- Step 01

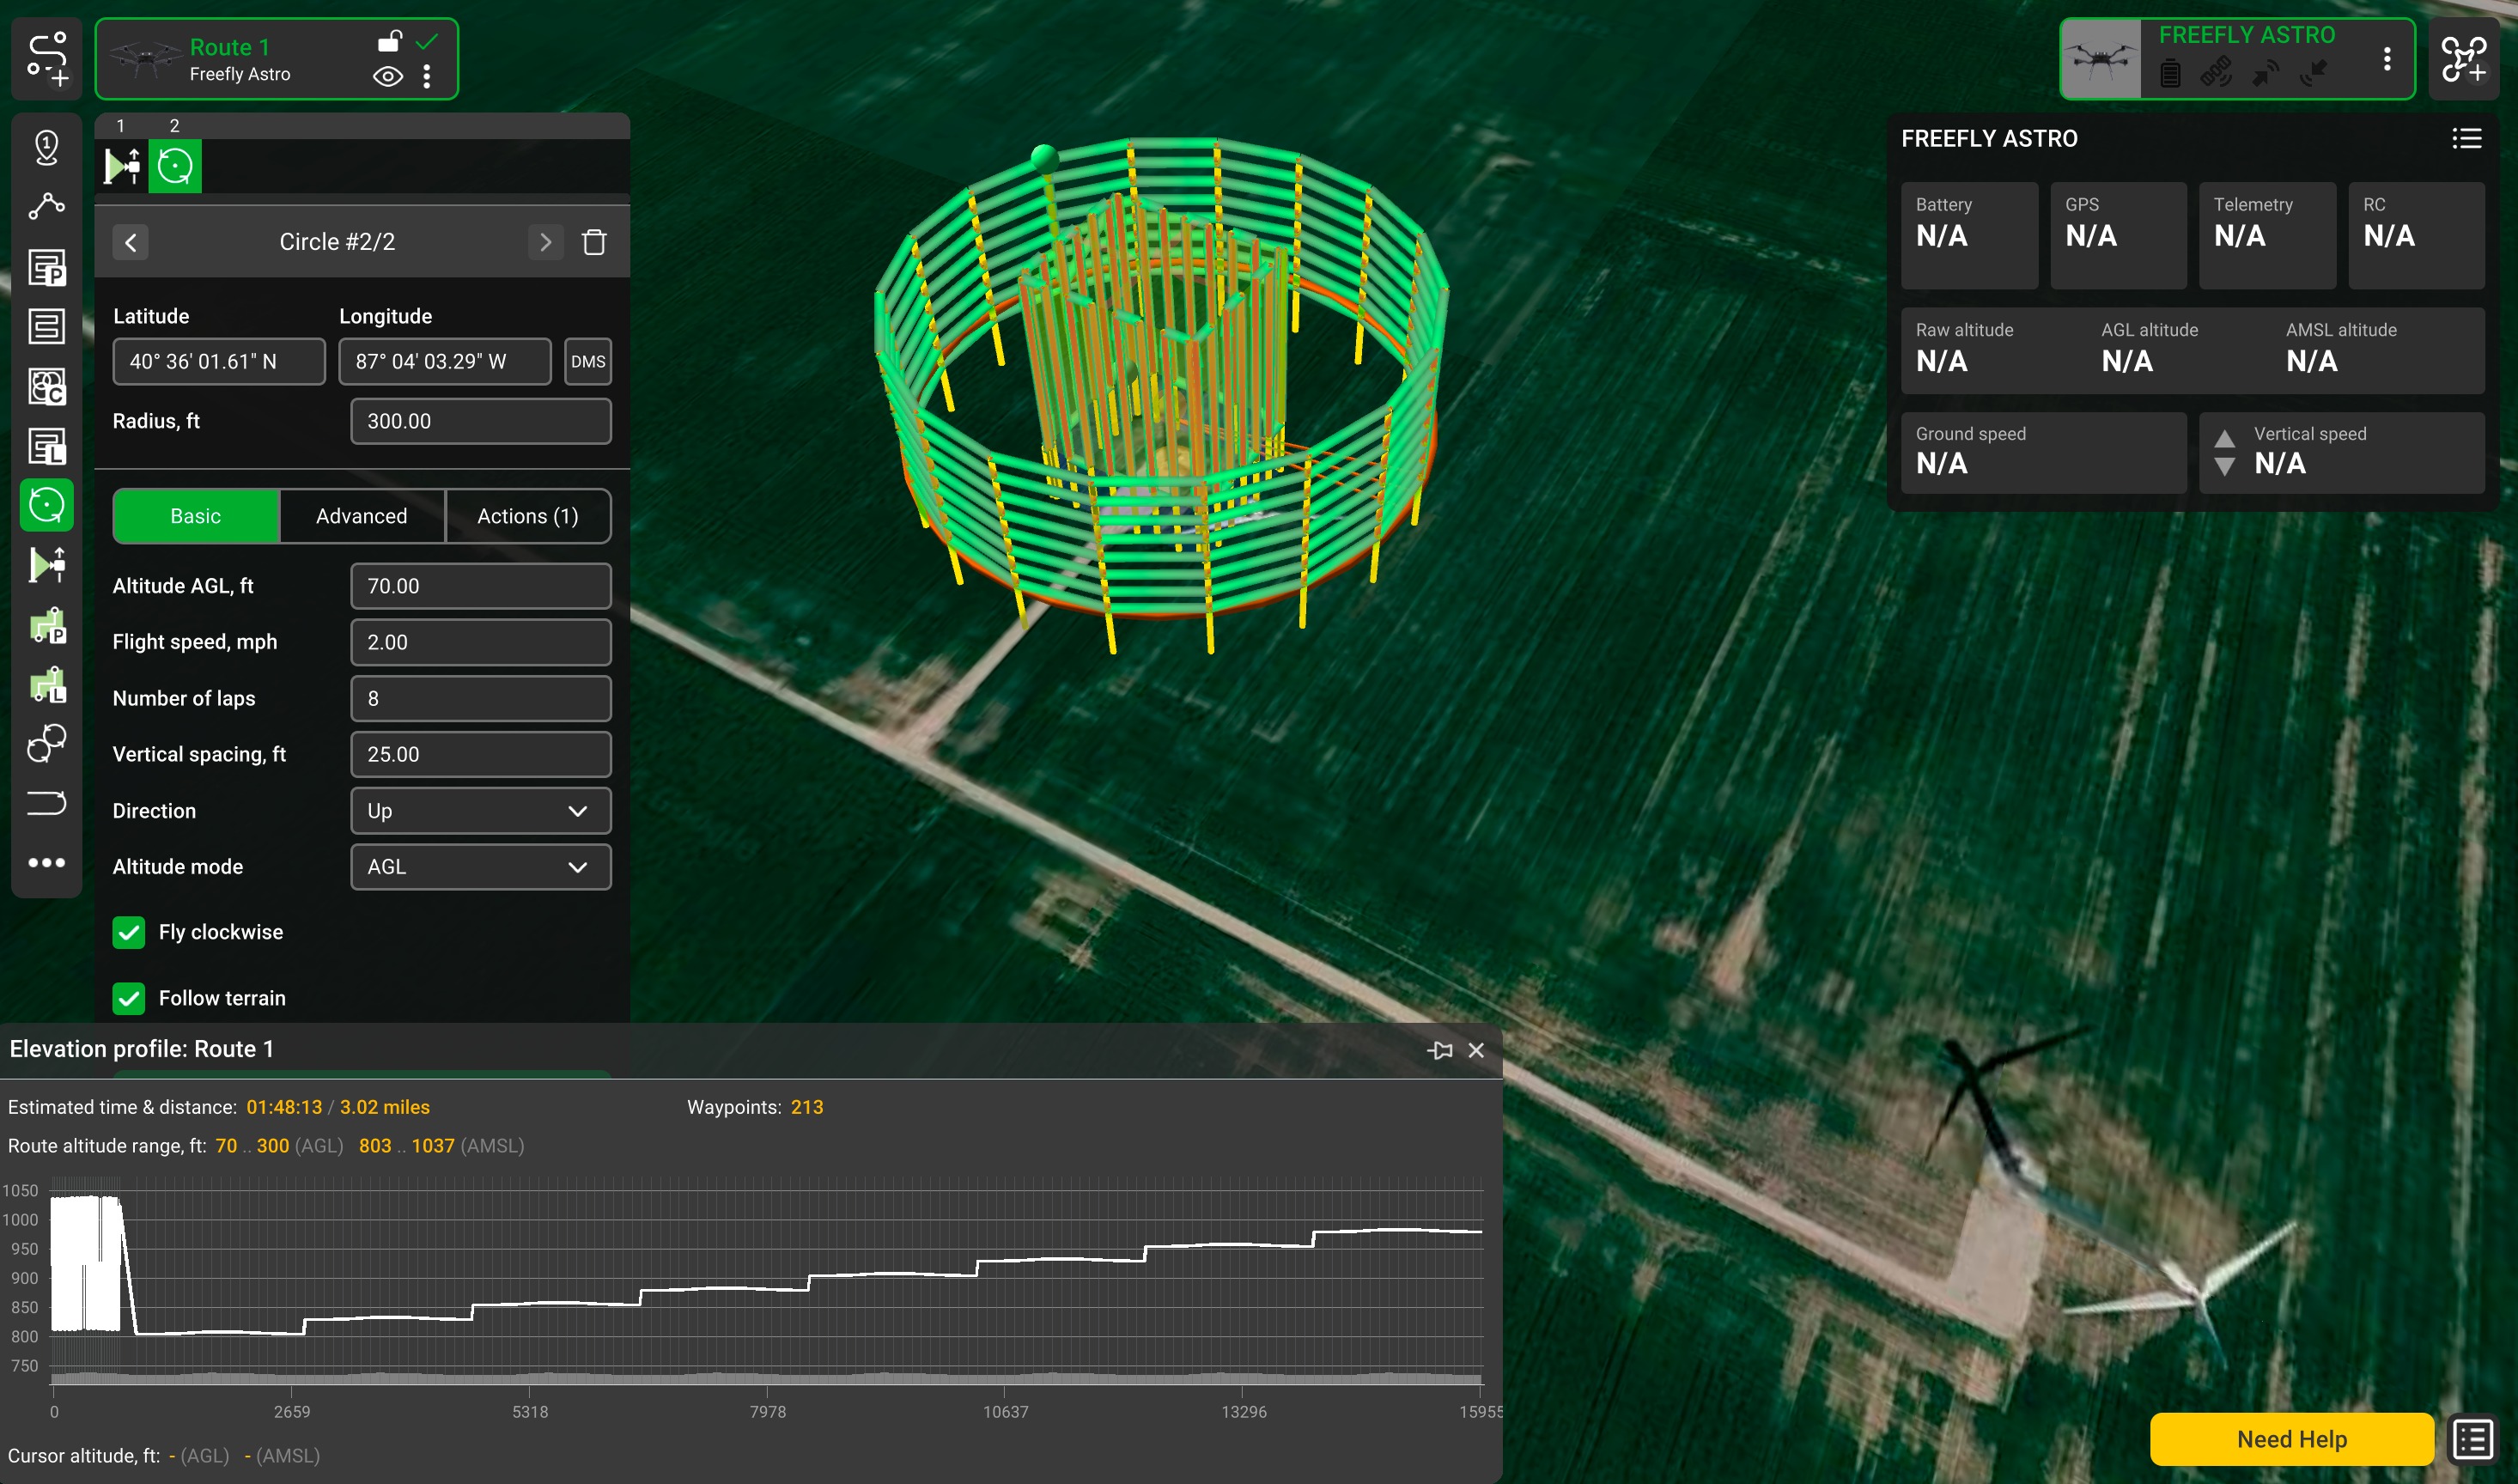
Mission Planning
Each turbine is programmed in UgCS with oblique (circlegrammetry) and vertical-scan flight paths and a fixed Ground Sampling Distance, so every blade face and tower section is captured at a repeatable, defect-legible resolution.
- Step 02


Field Capture
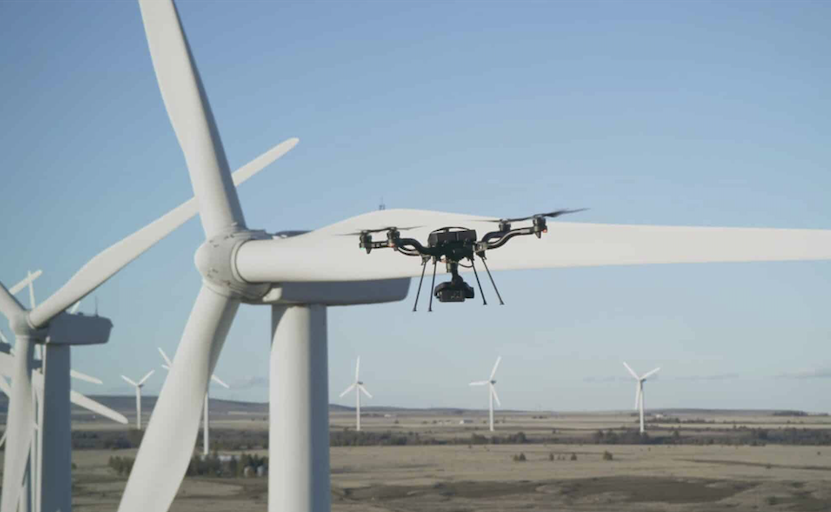
The UgCS mission is transferred by USB to the Herelink controller and uploaded to AMC (Auterion Mission Control), which flies the routes autonomously on American-made Freefly Astro aircraft — pressure and suction sides, leading and trailing edges, root, and tip with high-resolution RGB and radiometric thermal payloads, no climb crews or extended curtailment.
- Step 03

Analysis & Reporting
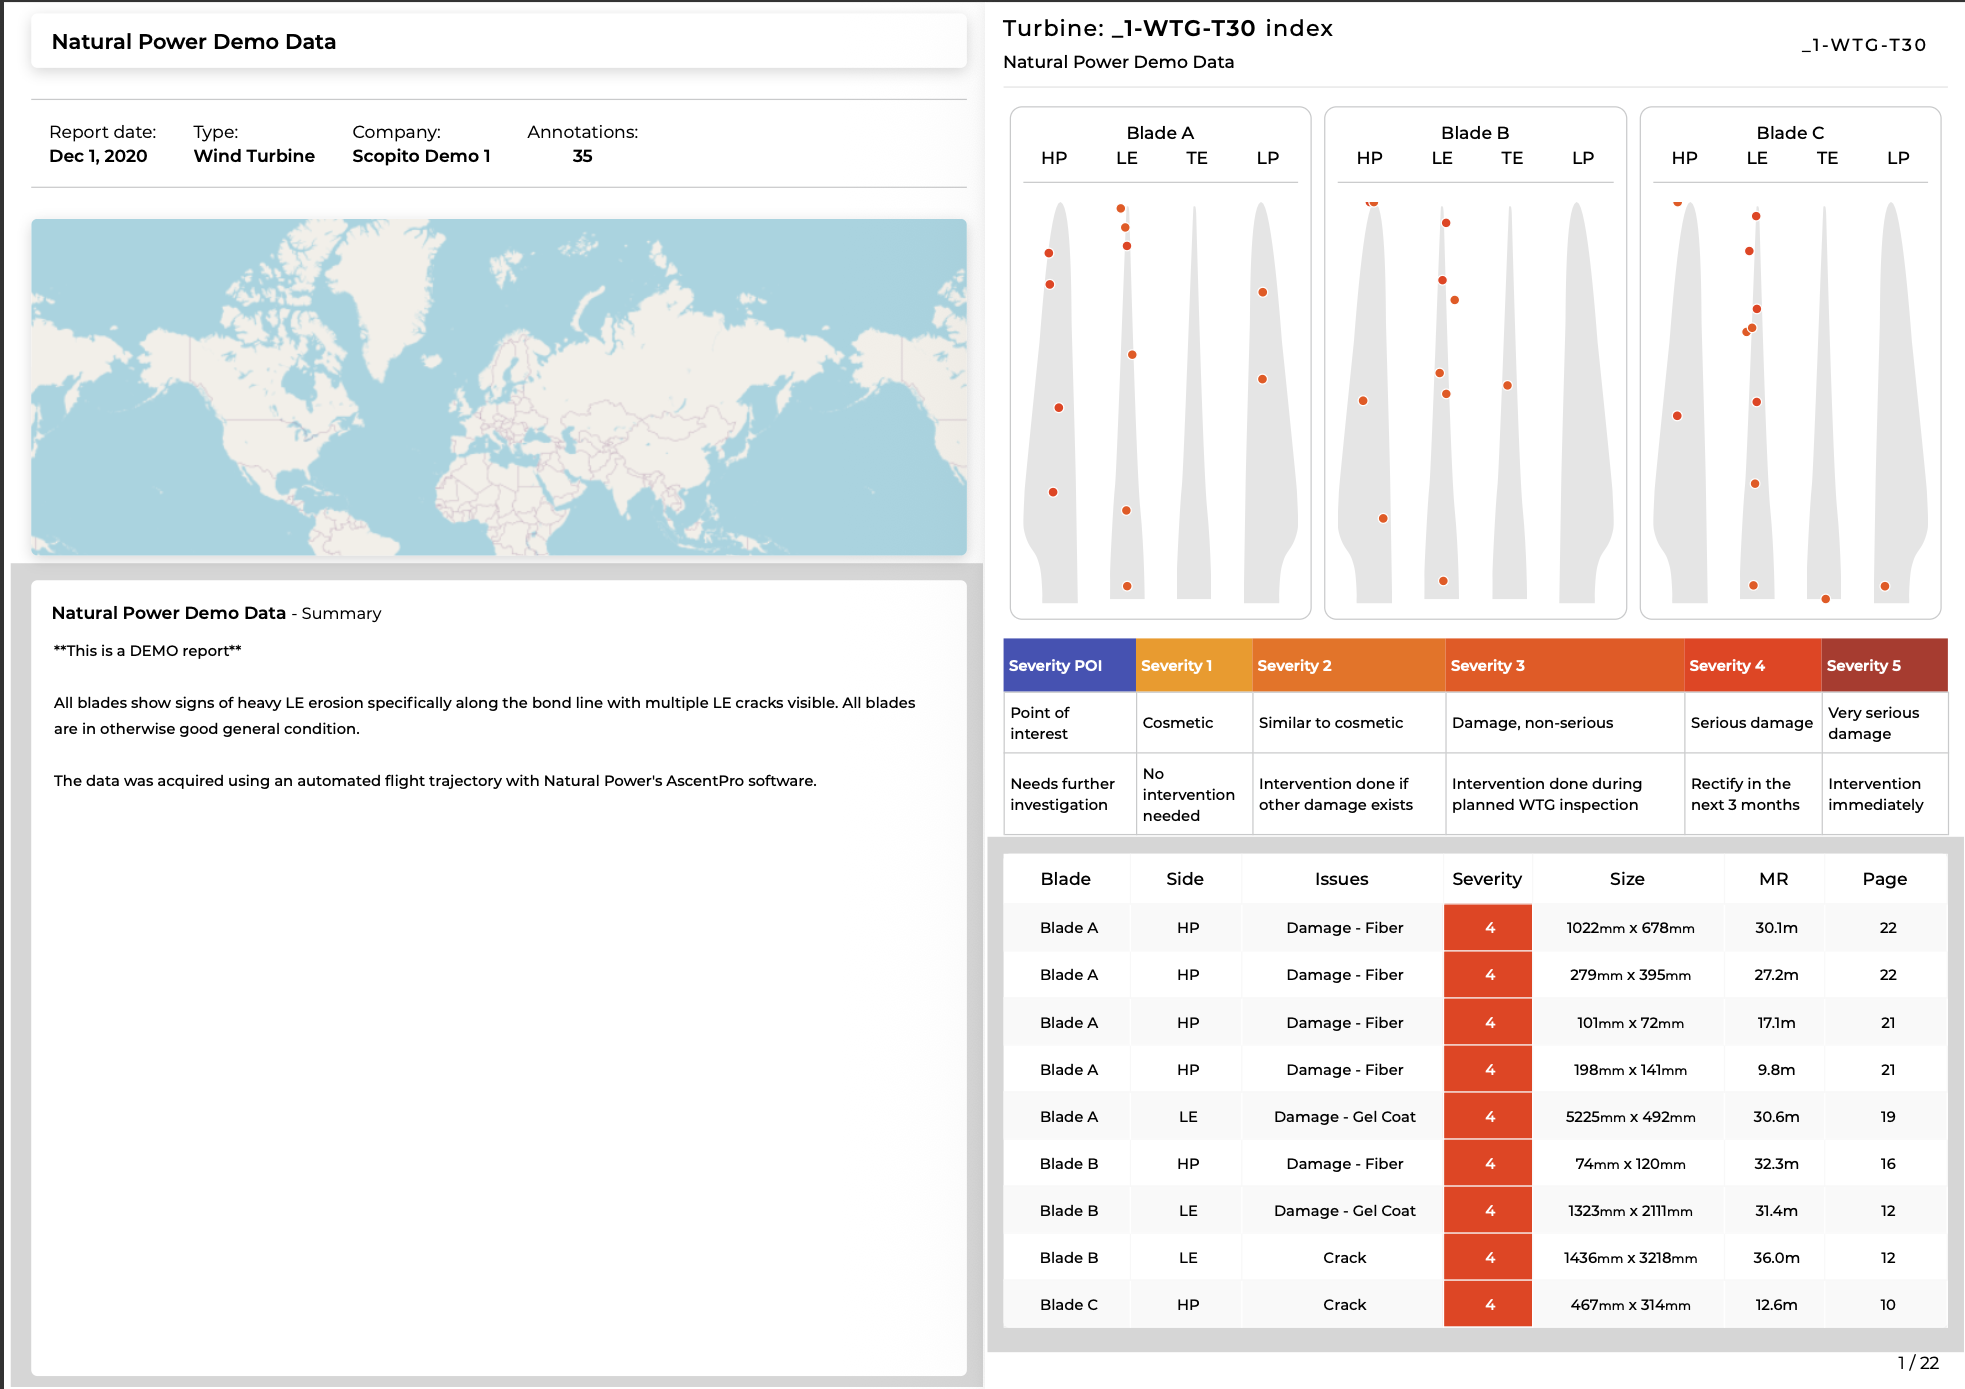
Imagery is analyzed in Scopito from root to edge — its AI fault detection and independent Blade Experts analysts (a Scopito third-party review service) annotate every defect, set severity levels, and plot each finding on the Live Turbine Diagram with its exact blade side, distance from root, and measured diameter. Results export as branded, high-quality PDF reports and dispatch straight to maintenance work orders.

Services MIR Provides
Blade Surface Inspection
Root-to-edge imaging of pressure and suction sides, leading and trailing edges, and gelcoat — documenting erosion, cracking, lightning-strike damage, and delamination for Scopito annotation and severity grading on the Live Turbine Diagram.
Tower & Nacelle Documentation
Vertical-scan imagery of tower cans, welds, fasteners, and nacelle exteriors for structural condition review and records.
Radiometric Thermal Capture
Temperature-referenced thermal data to flag anomalies across components and support lightning-protection and condition review.
Site & Access Mapping
RTK-referenced orthomosaics and surface models of pads, laydown yards, and access roads for crane planning and coordination.
Progress & Existing-Condition Records
Repeatable collection for construction progress, pre- and post-event documentation, and blade-to-blade change comparison over time.
Approved-Vendor & Program Support
Support for approved-vendor onboarding, inspection programs, and overflow data collection — with records your procurement, asset-management, and inspection-program teams can route, review, and approve.
Repowering Support, Start to Finish
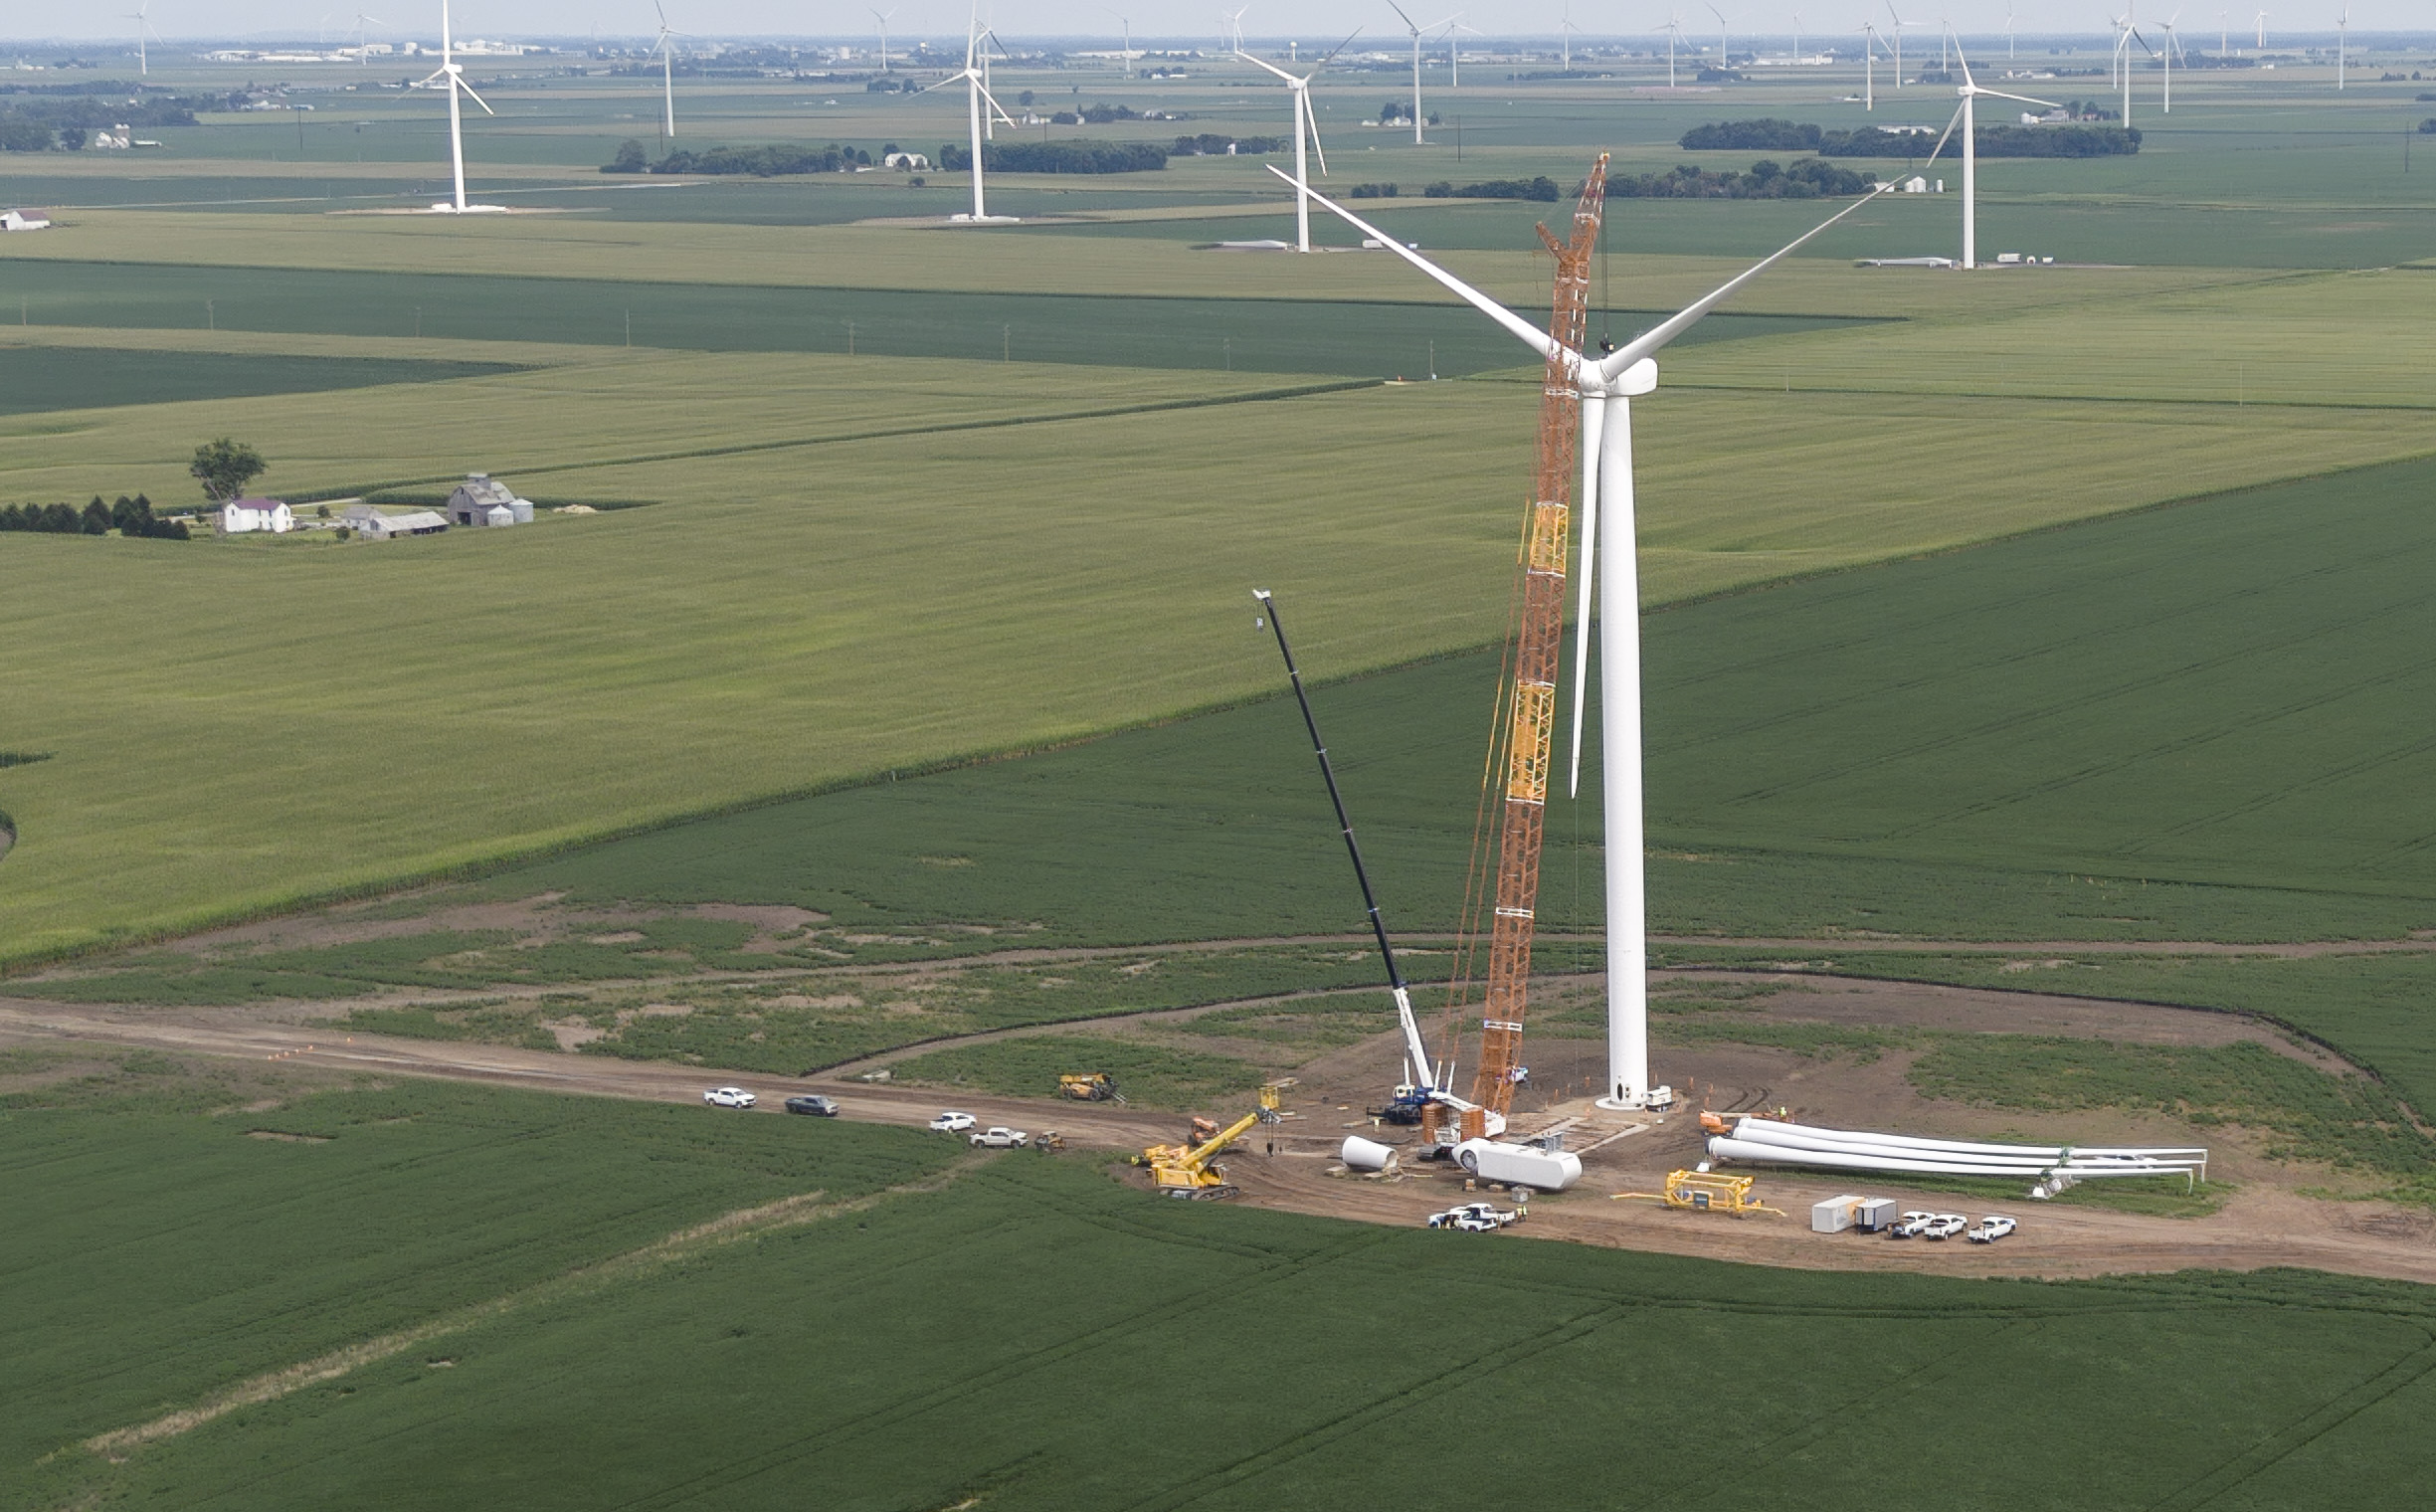
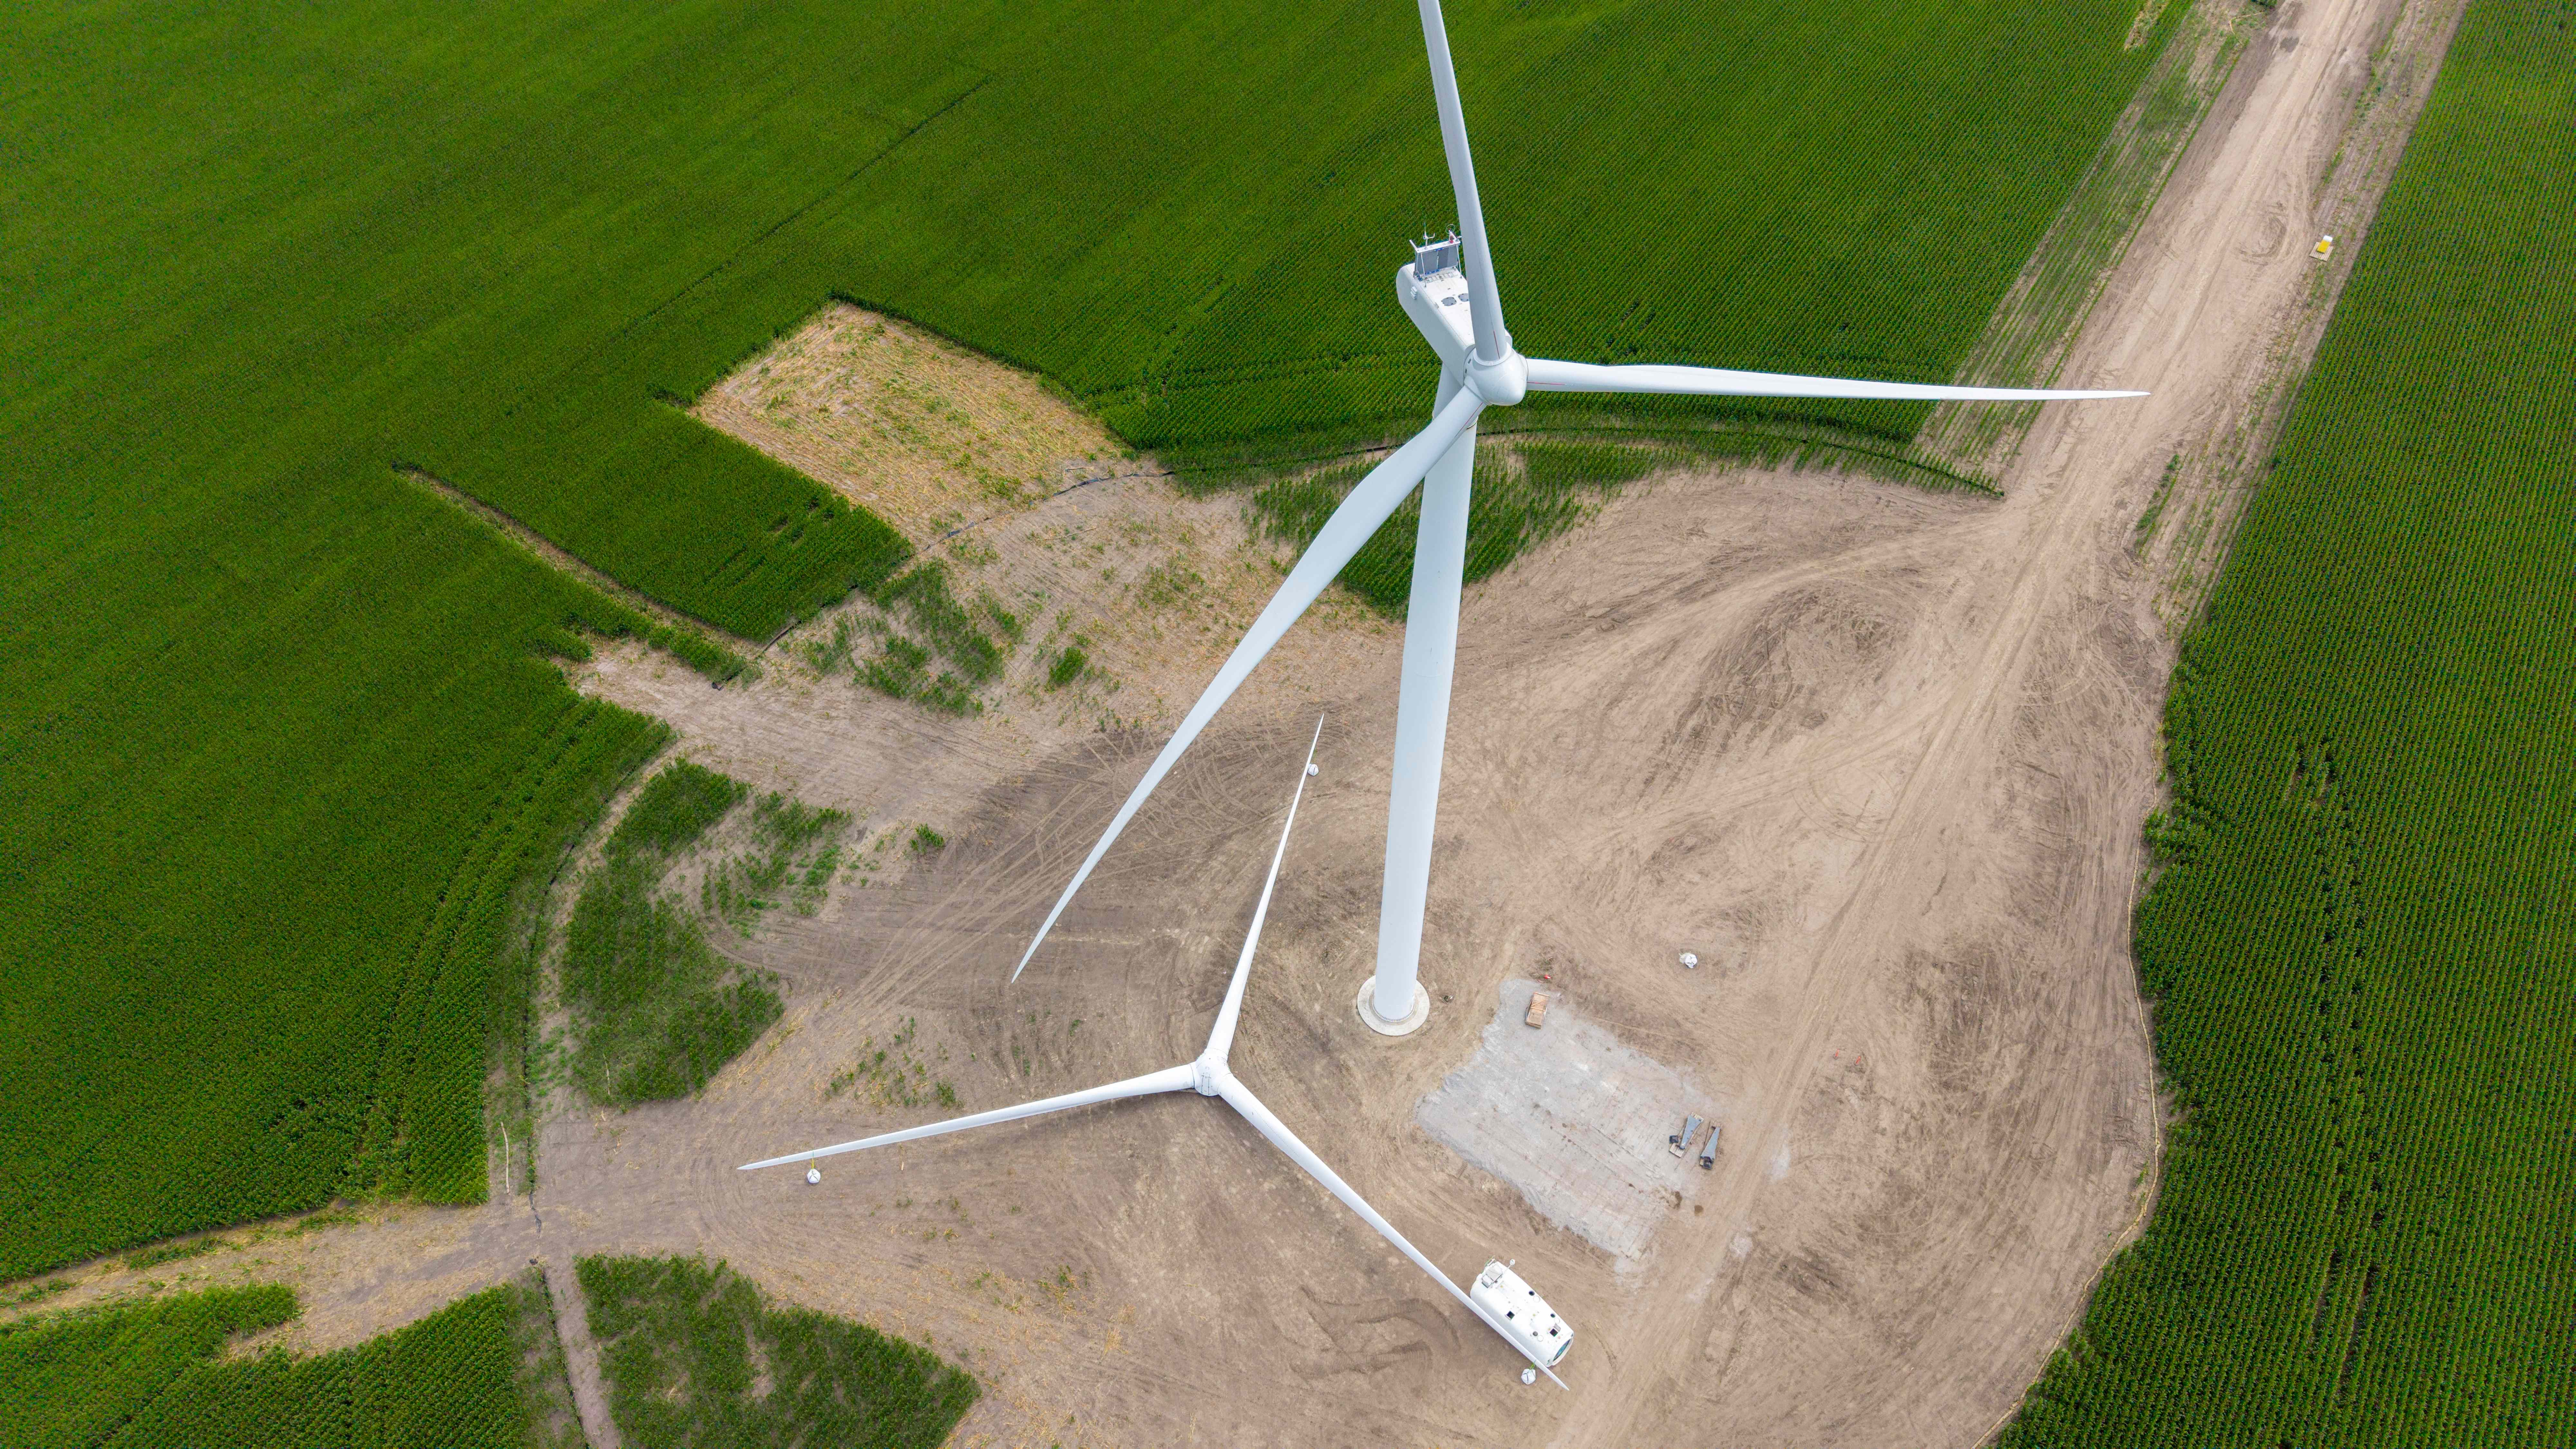
As aging fleets repower — swapping nacelles and blades onto existing towers, pouring concrete foundation collars to carry the loads of larger rotors, or grading new pads — every phase generates measurable data that is easy to lose. MIR captures it as a defensible record: crop-damage acreage for landowner settlements, existing-condition baselines of every new machine, and elevation, mesh, and thermal data across the pad, turbine, and connected substation.
Site & Construction
Crop-Damage Acreage
RTK orthomosaics that measure disturbed and damaged crop area around pads, laydown yards, and crane paths — acreage documented for landowner settlements and restoration tracking.
Pad & Foundation Elevation Maps
DSM/DTM surface models of new pads, or existing pads with added foundation collars — surface, volume, and elevation context documented before, during, and after construction.
Full-Site 3D Mesh
Textured photogrammetry mesh of the full site — pad, foundation, and turbine — for as-built documentation, clearance checks, and coordination.
Turbine Baseline & Acceptance
As-Built Inspection Baseline
A structured, georeferenced capture of each new machine at commissioning — the measurable Day-One baseline every future inspection is compared against.
Incoming-Condition Inspection
High-resolution imaging of blades and components on arrival — documenting transport or handling damage before they go up the tower.
Blade Thermography
Radiometric thermal passes that flag subsurface anomalies — voids and delamination within the fiberglass laminate that visual imagery cannot reveal.
Substation & Transmission
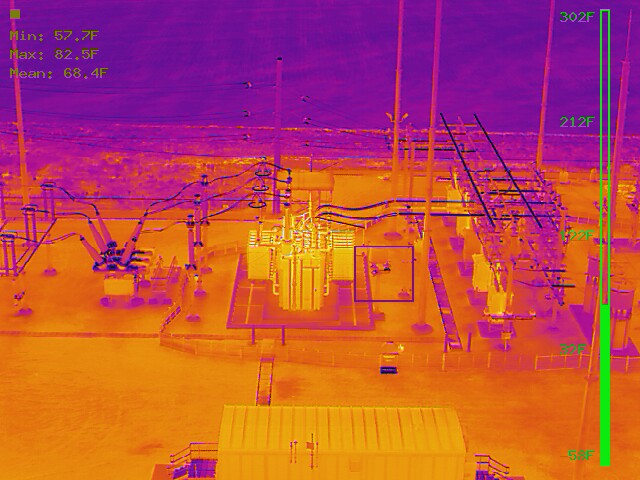
Substation, Line & Tower Thermal
Radiometric thermal inspection across the connected grid — surfacing hotspots at substation transformers, buswork, and insulators, plus overhead conductors, splices, and dead-ends on high-voltage transmission towers.
LiDAR Line & Clearance
Point-cloud capture of collector and transmission lines to measure conductor sag, ground clearance, and vegetation encroachment against clearance standards.
New Substation Photogrammetry
RTK photogrammetry capturing terrain and existing-condition data of new substation sites for licensed survey/engineering review, planning support, and construction documentation.
The Equipment We Bring To Your Site
Each project is scoped to the required collection method. RGB, radiometric thermal, and LiDAR are deployed in purpose-built acquisition passes based on the required deliverables — RTK-referenced so your data comes back well-documented and ready to use.
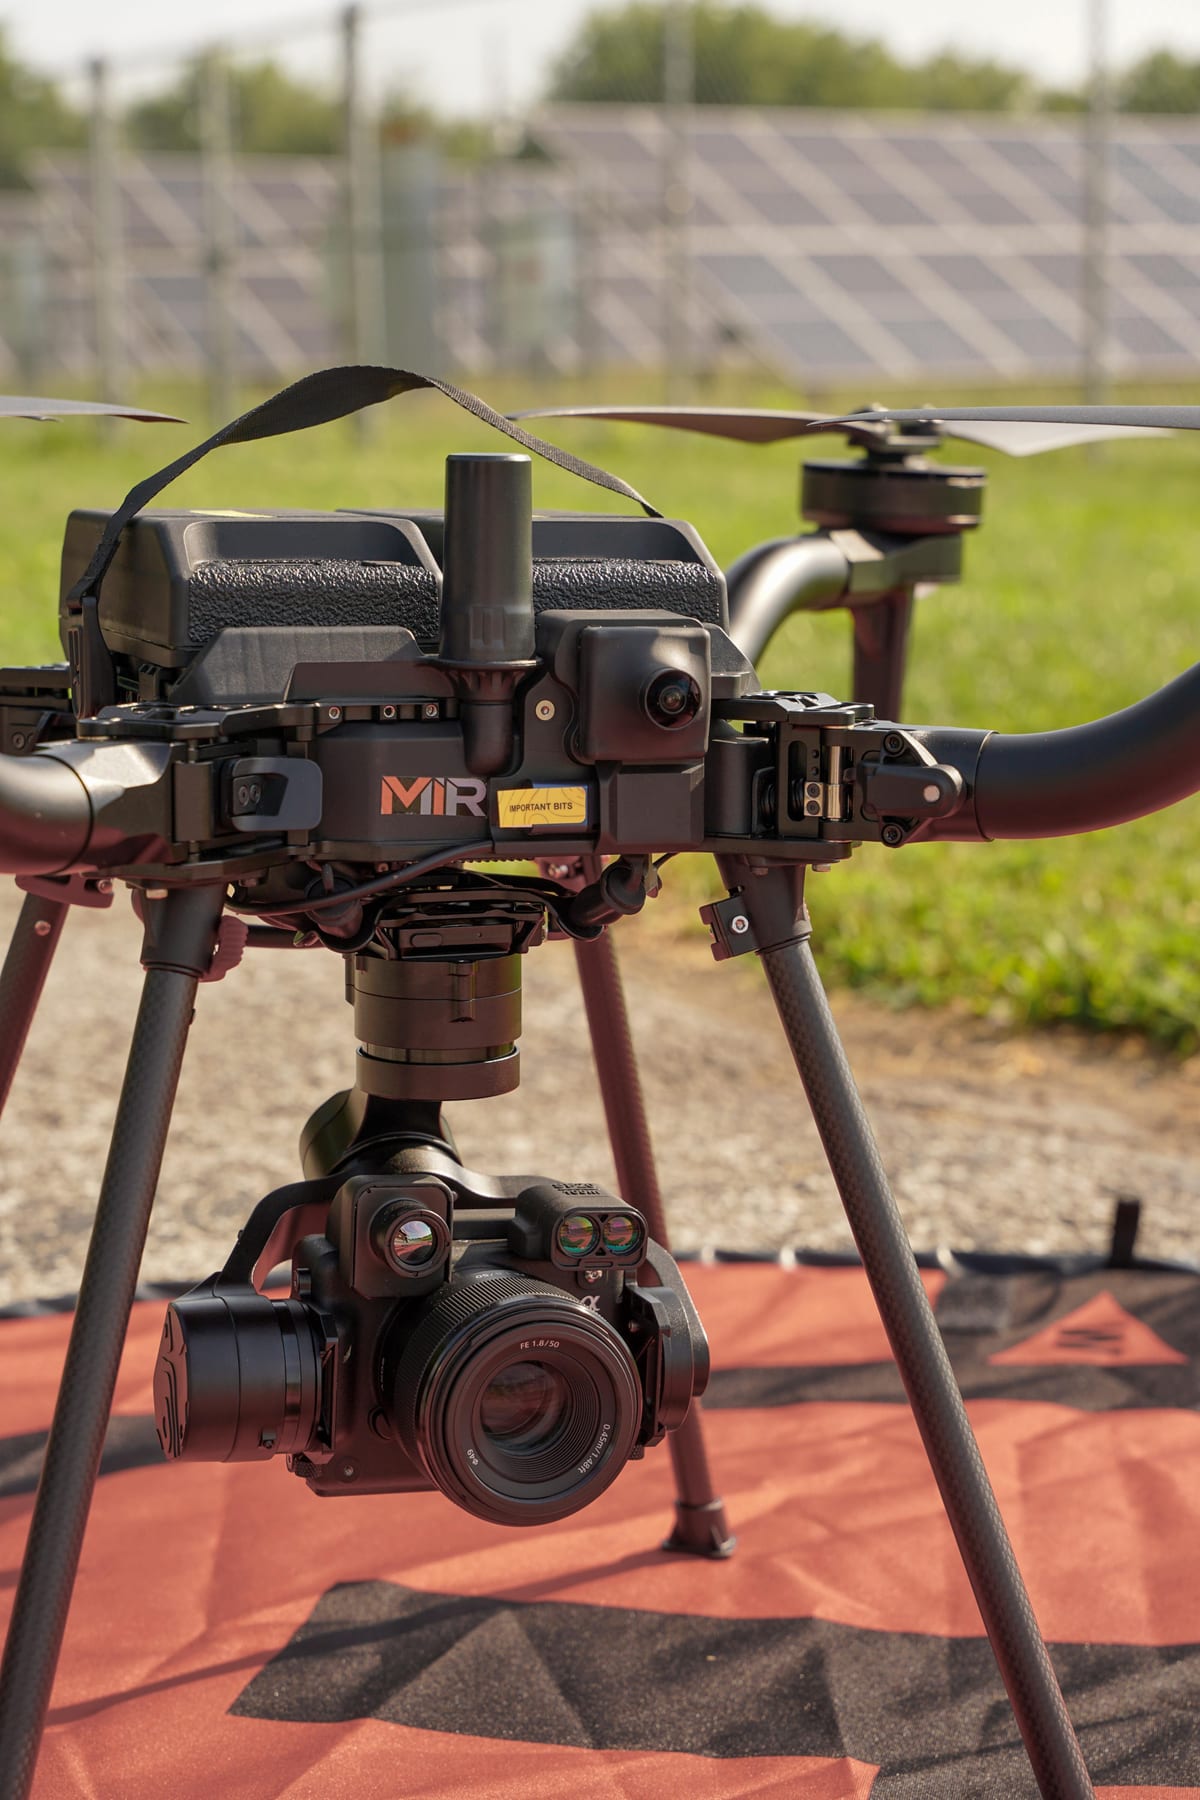
Freefly Astro
Blue UAS aircraft
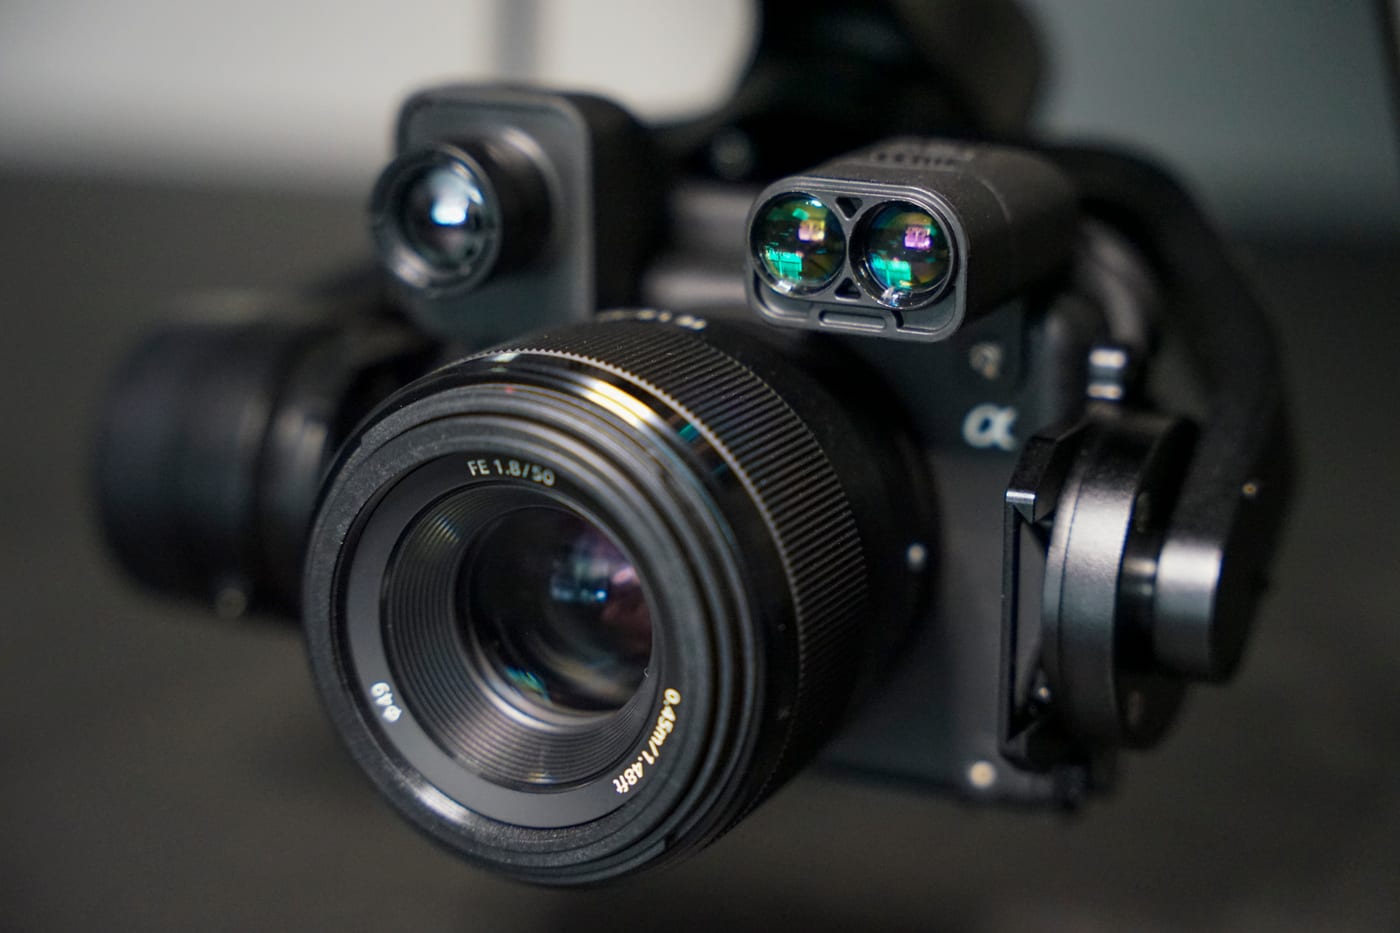
Sony 61MP RGB
High-resolution imagery
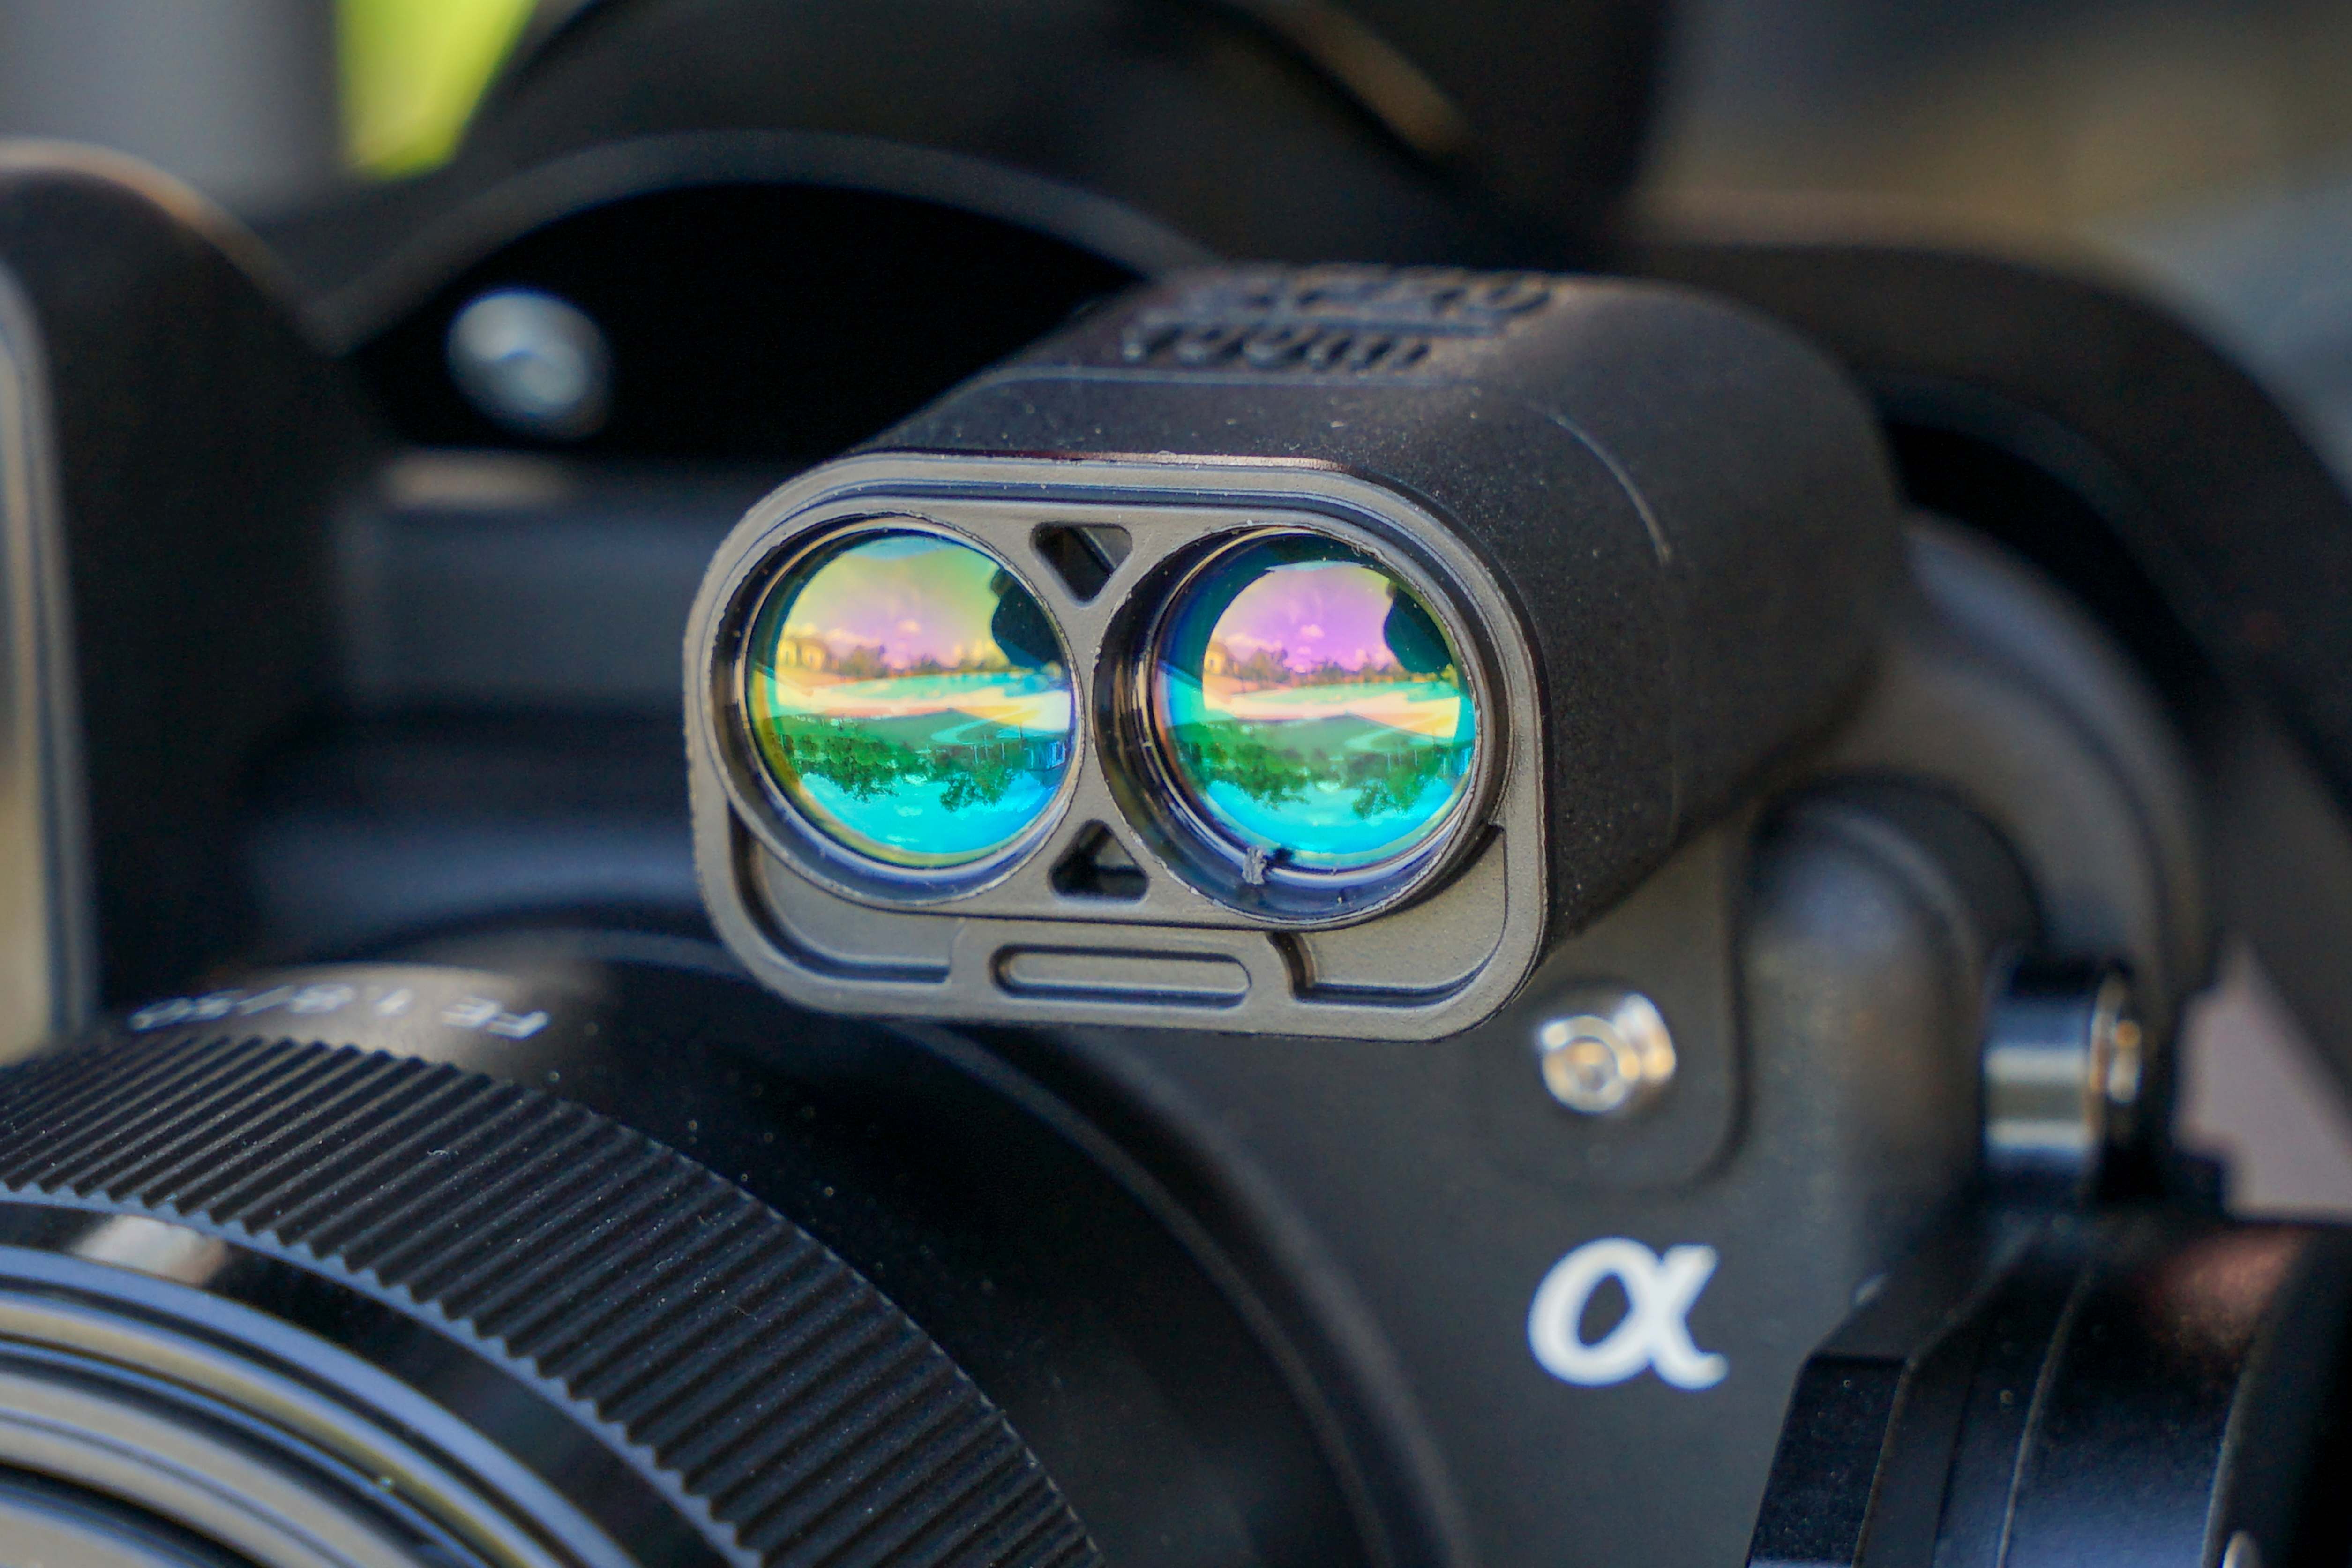
Radiometric Thermal
Calibrated heat mapping
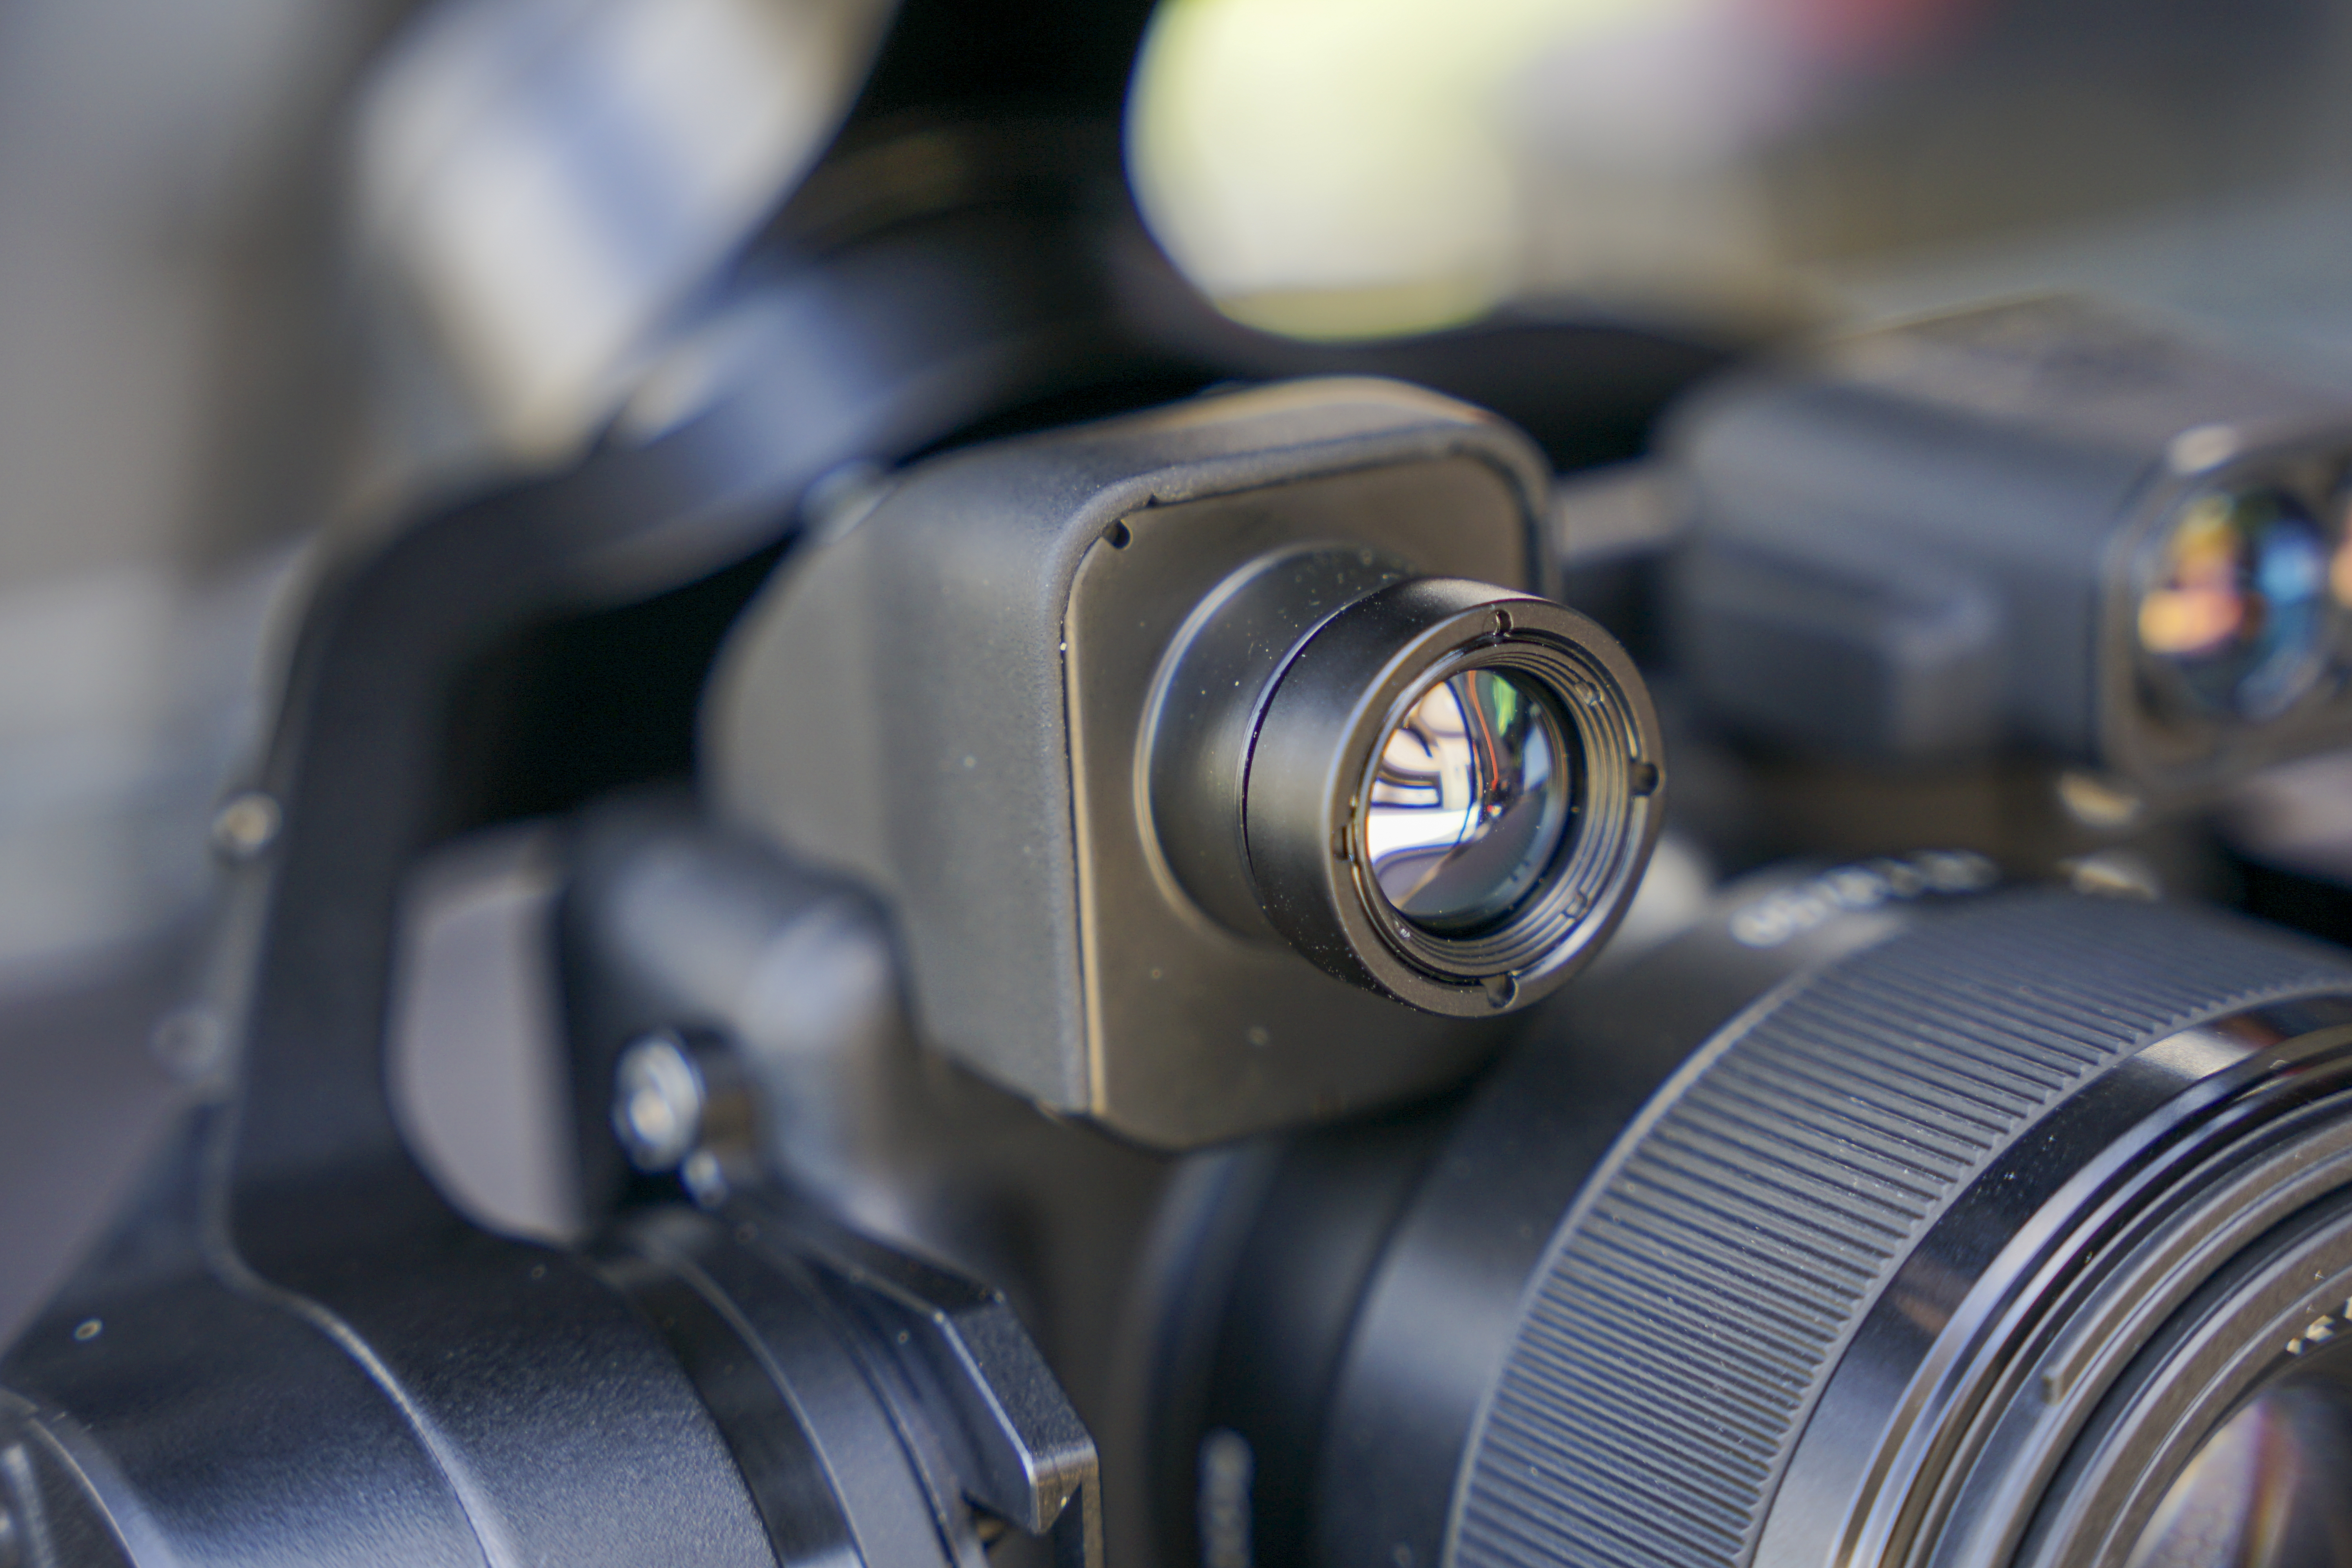
Laser Rangefinder
Direct distance & clearance
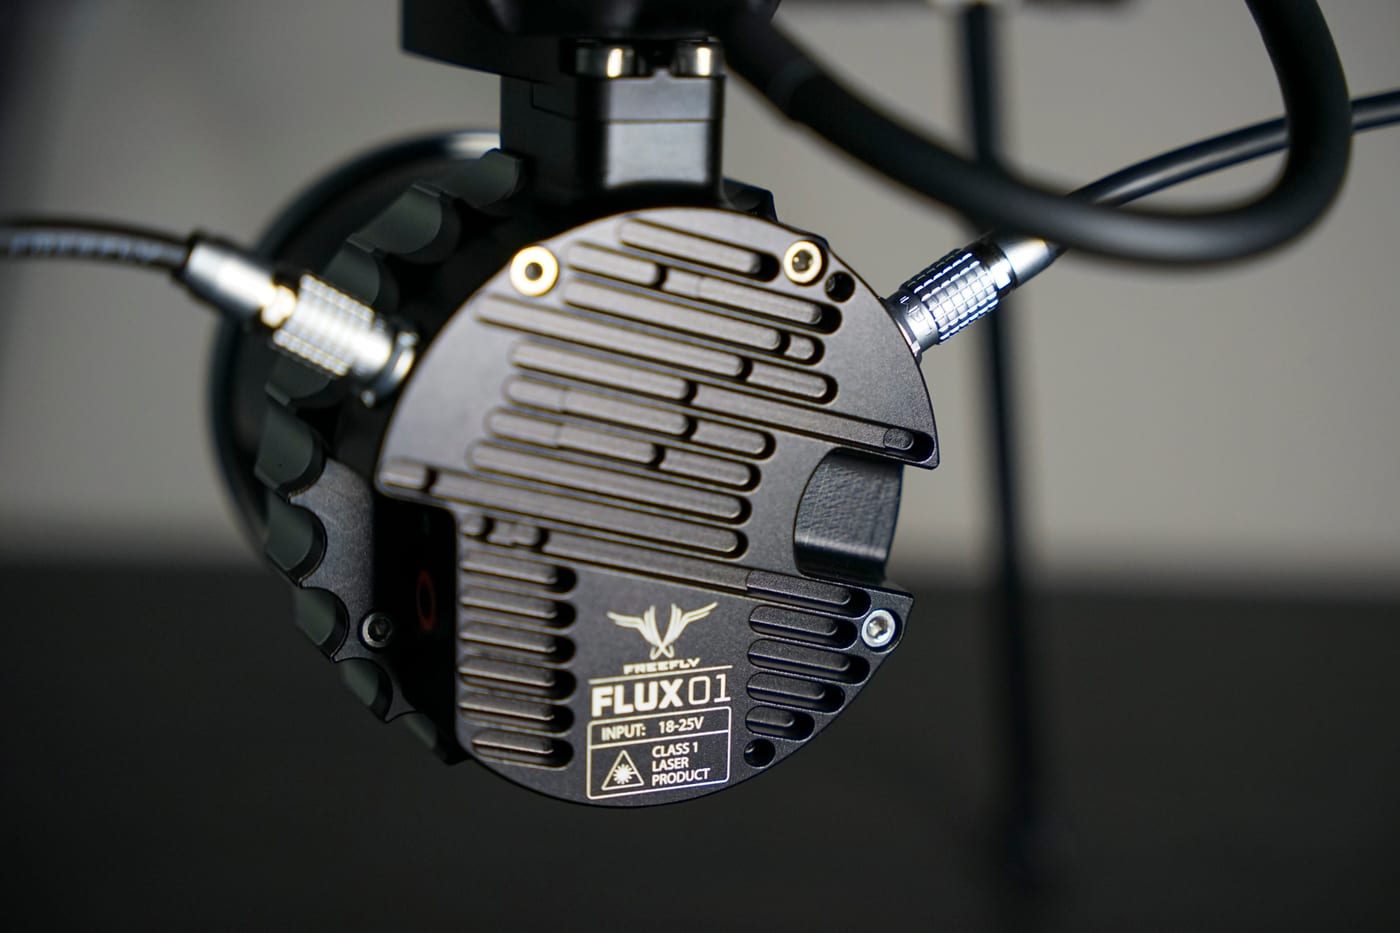
Freefly Flux O1
LiDAR acquisition
RTK Positioning
InCORS NTRIP · WGS 84
Every defect, located and graded
One inspection, one file. Mapped to blade, side, and distance from root, measured in millimeters, and ready for your work order system.
Live turbine diagram
Every defect mapped to blade, side, distance from root, and measured diameter.
Severity grading
Scopito AI fault detection, reviewed and confirmed by its independent Blade Experts analysts.
Imagery and thermal
High-resolution blade, tower, and nacelle imagery with radiometric thermal.
Representative Scopito Output
Inside a Scopito Blade Report
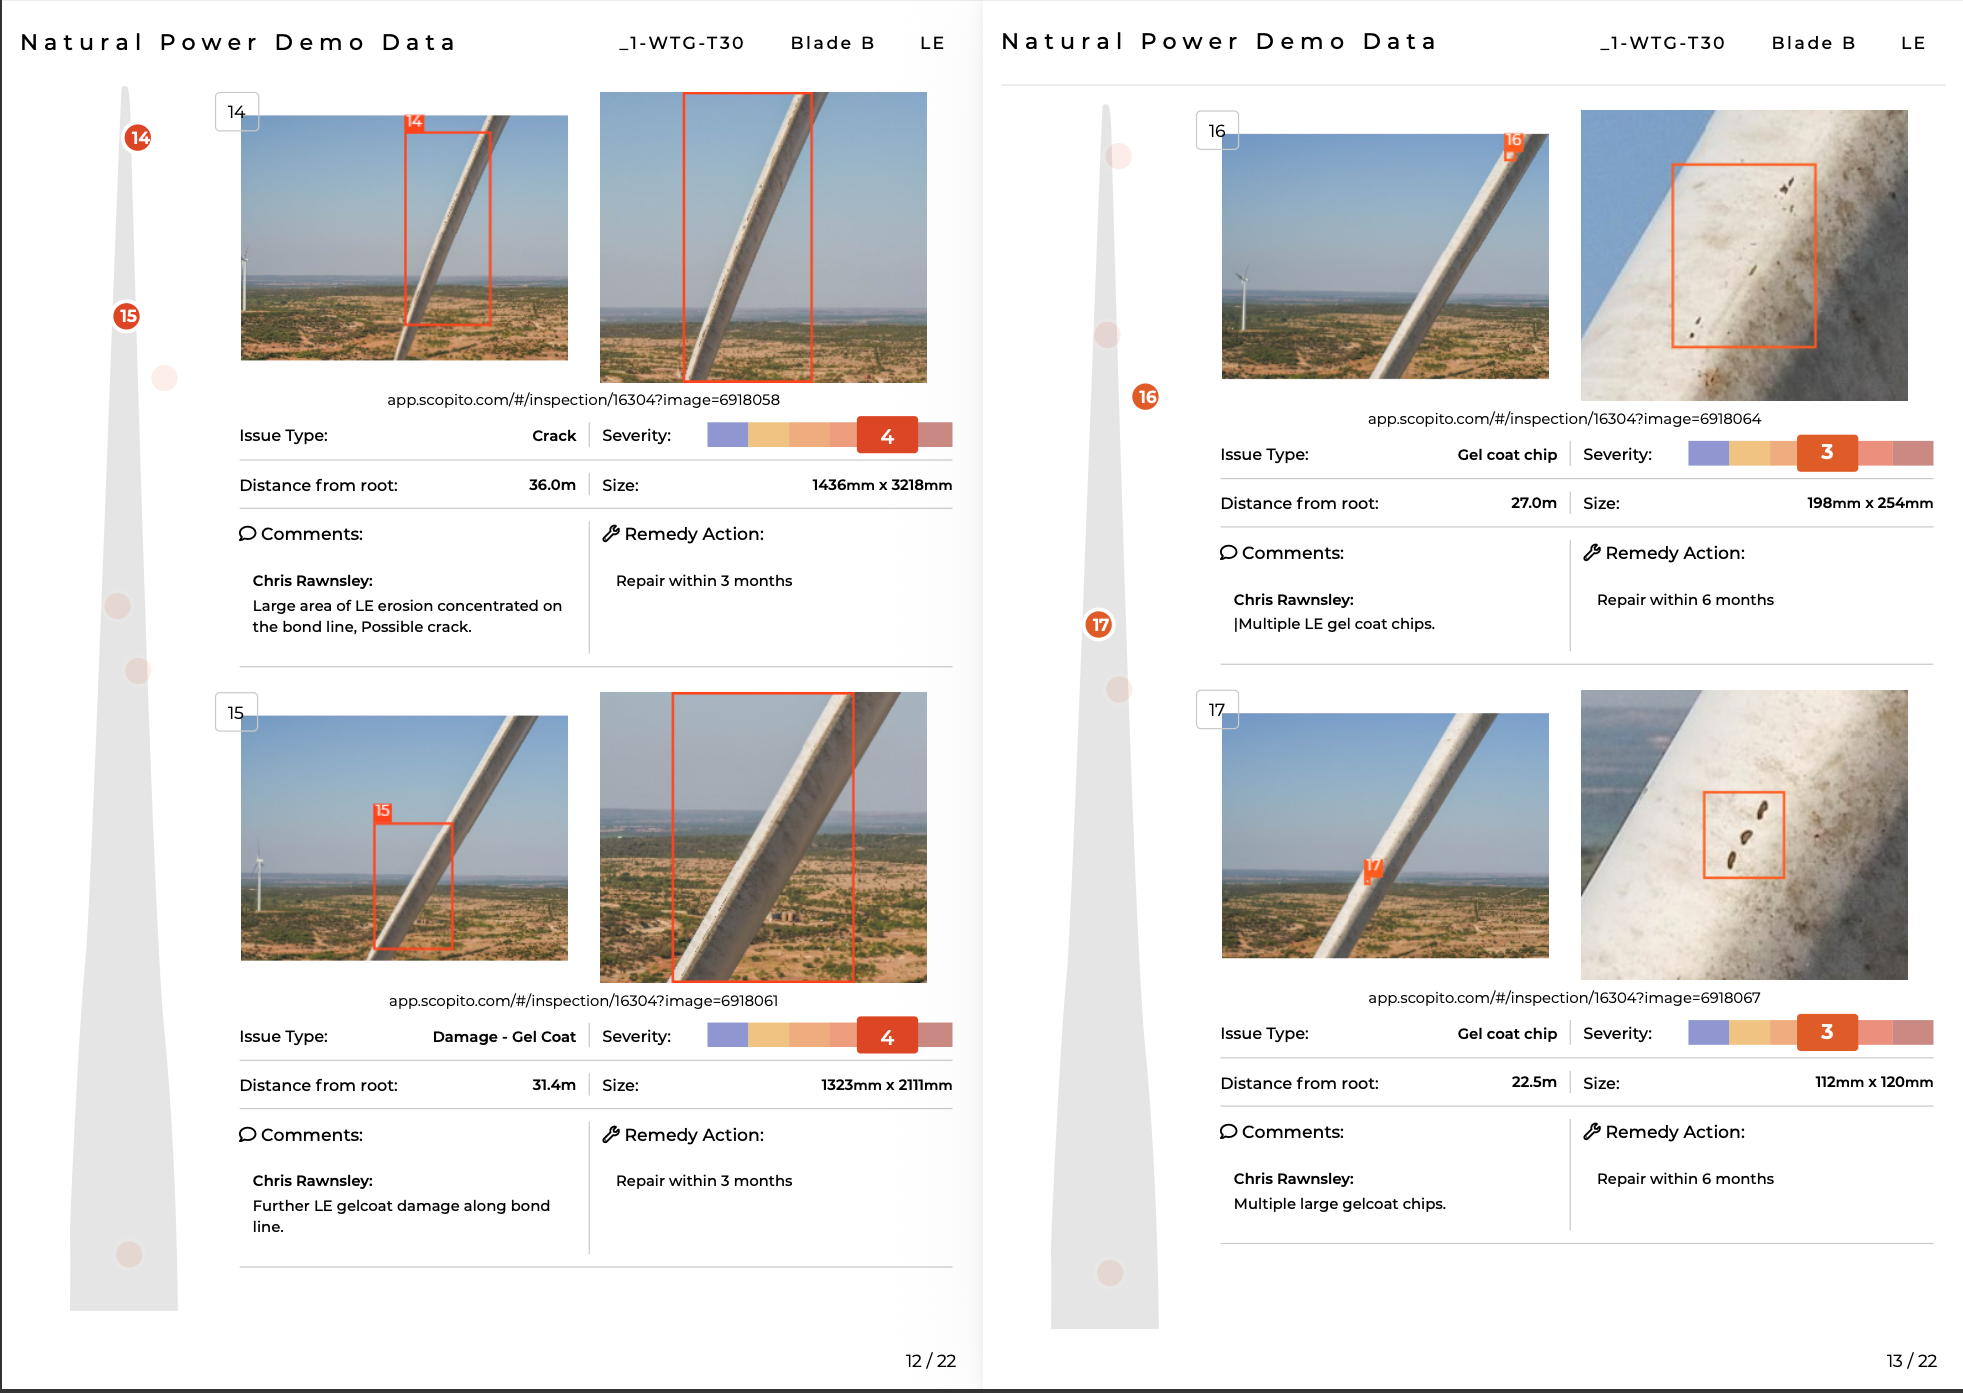 Sev 4 · Crack
Blade B leading-edge crack
Leading-edge structural crack flagged for near-term repair.
- Size
- 1436 × 3218 mm
- From root
- 36.0 m
- Remedy
- Repair < 6 months
Report cover
Live turbine diagram and severity legend
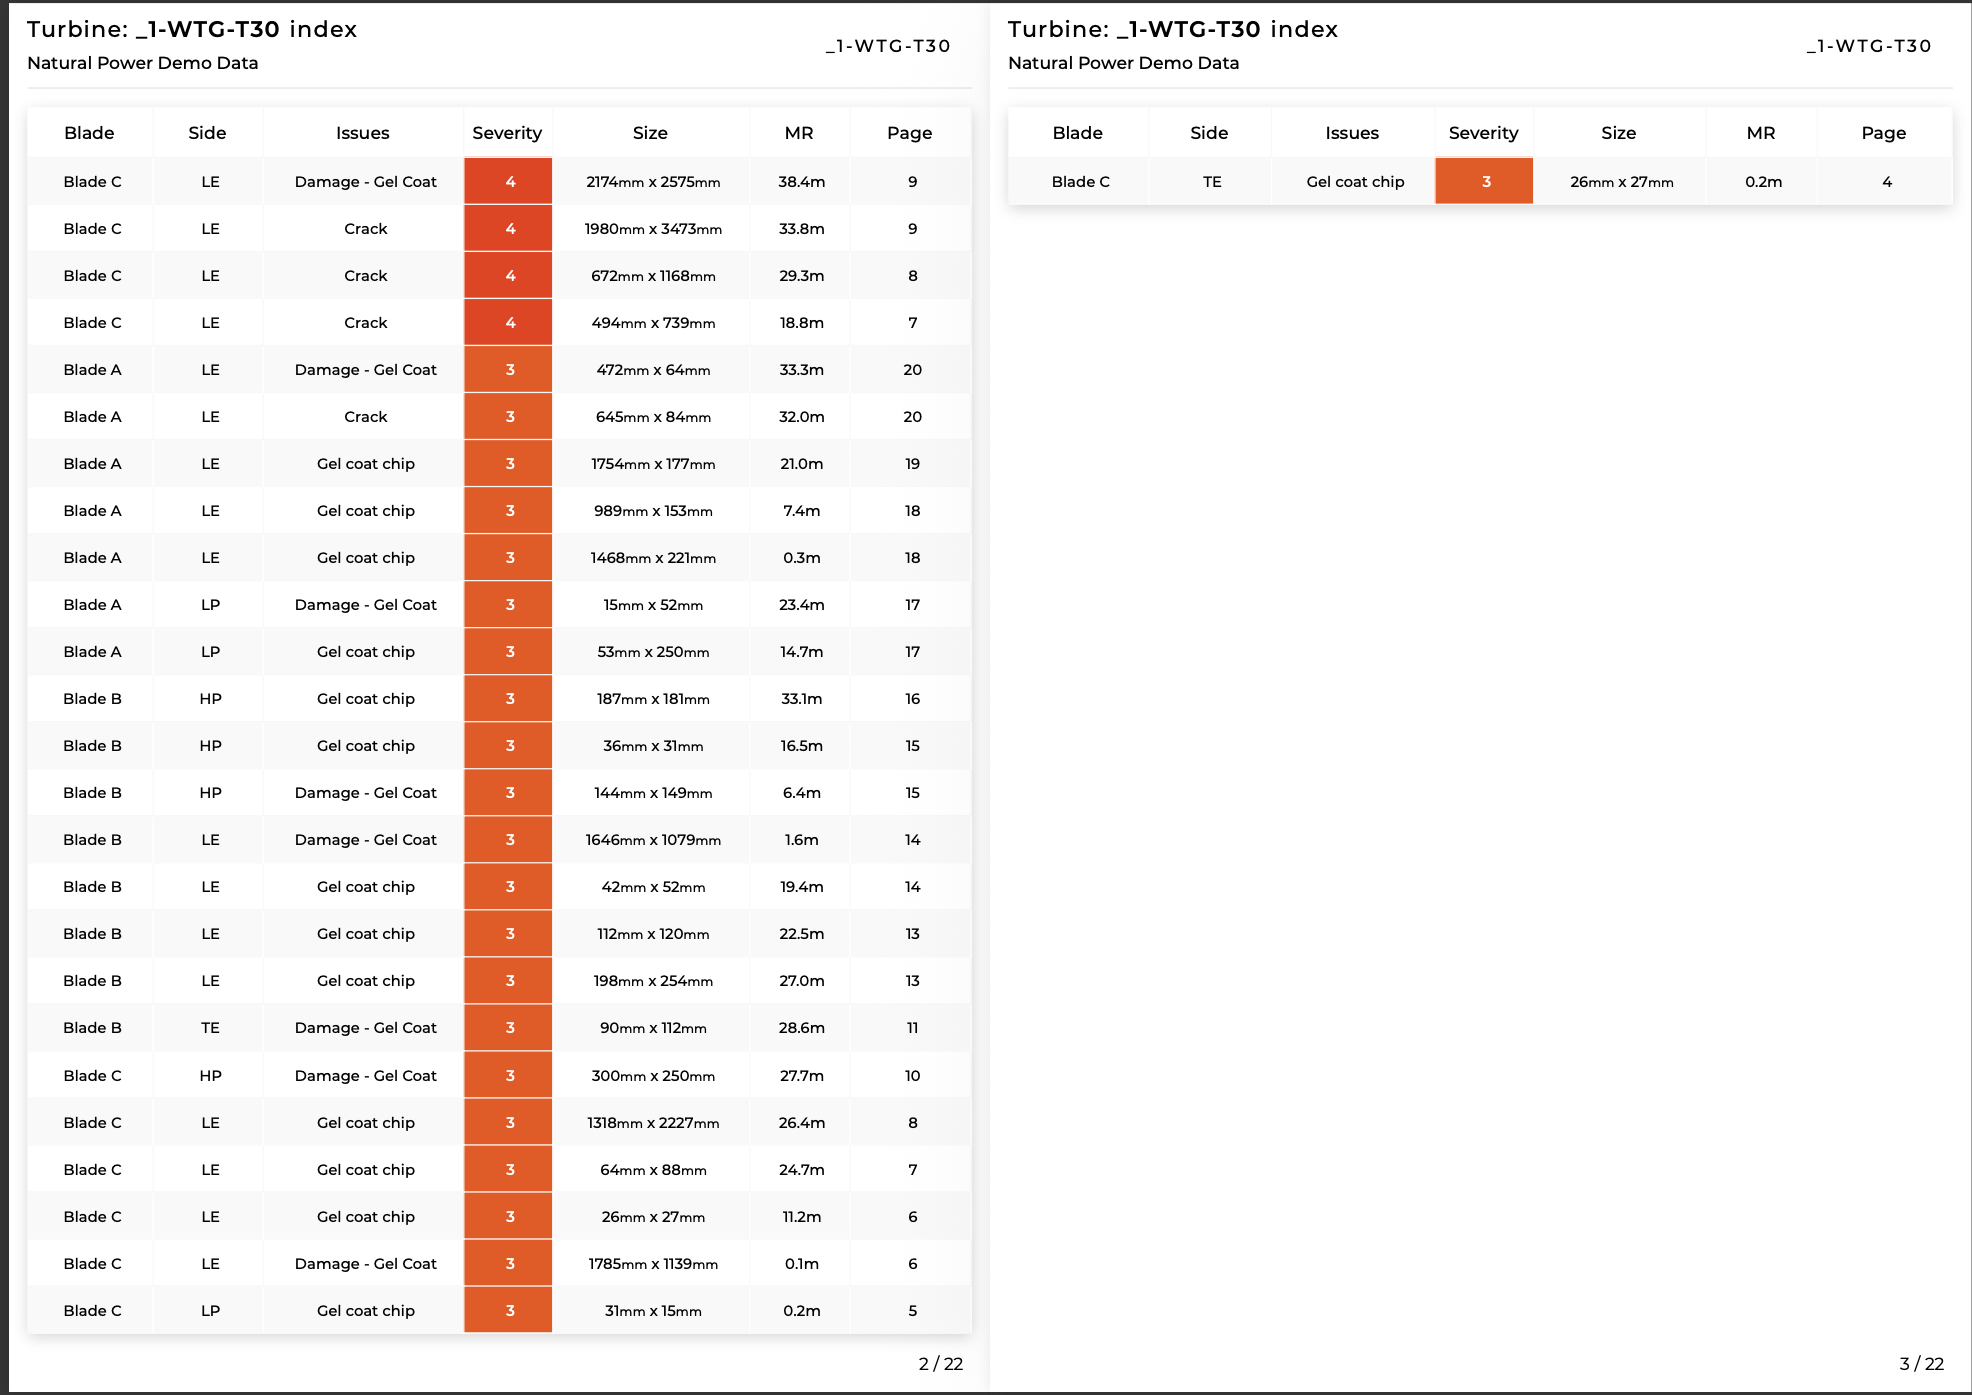
Turbine damage index
Every finding, severity-ranked
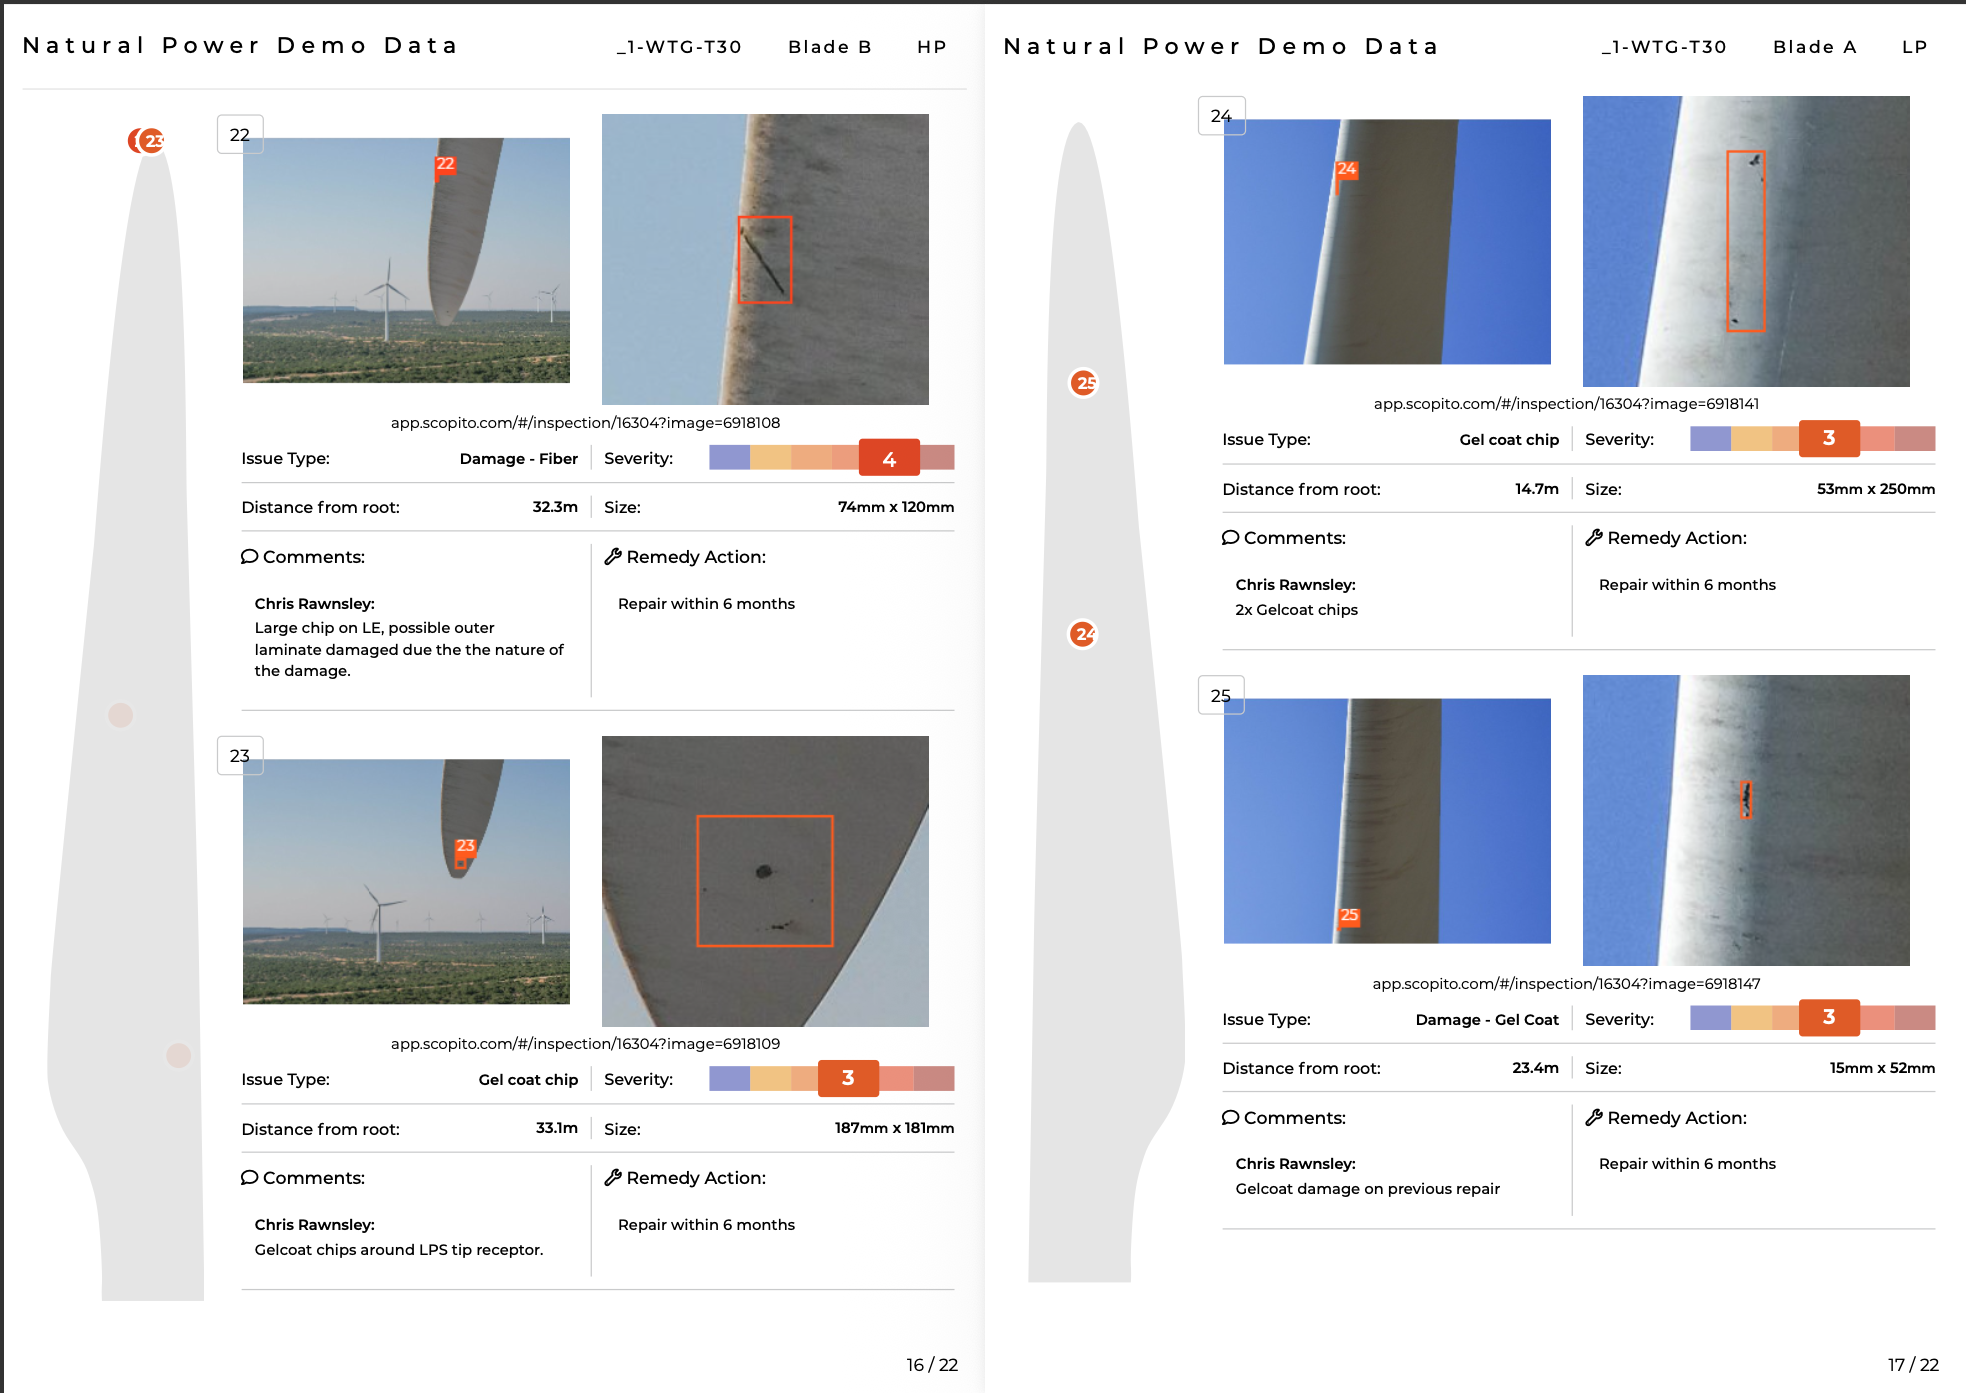 Sev 4 · Fiber
Fiber damage
Blade B, laminate concern
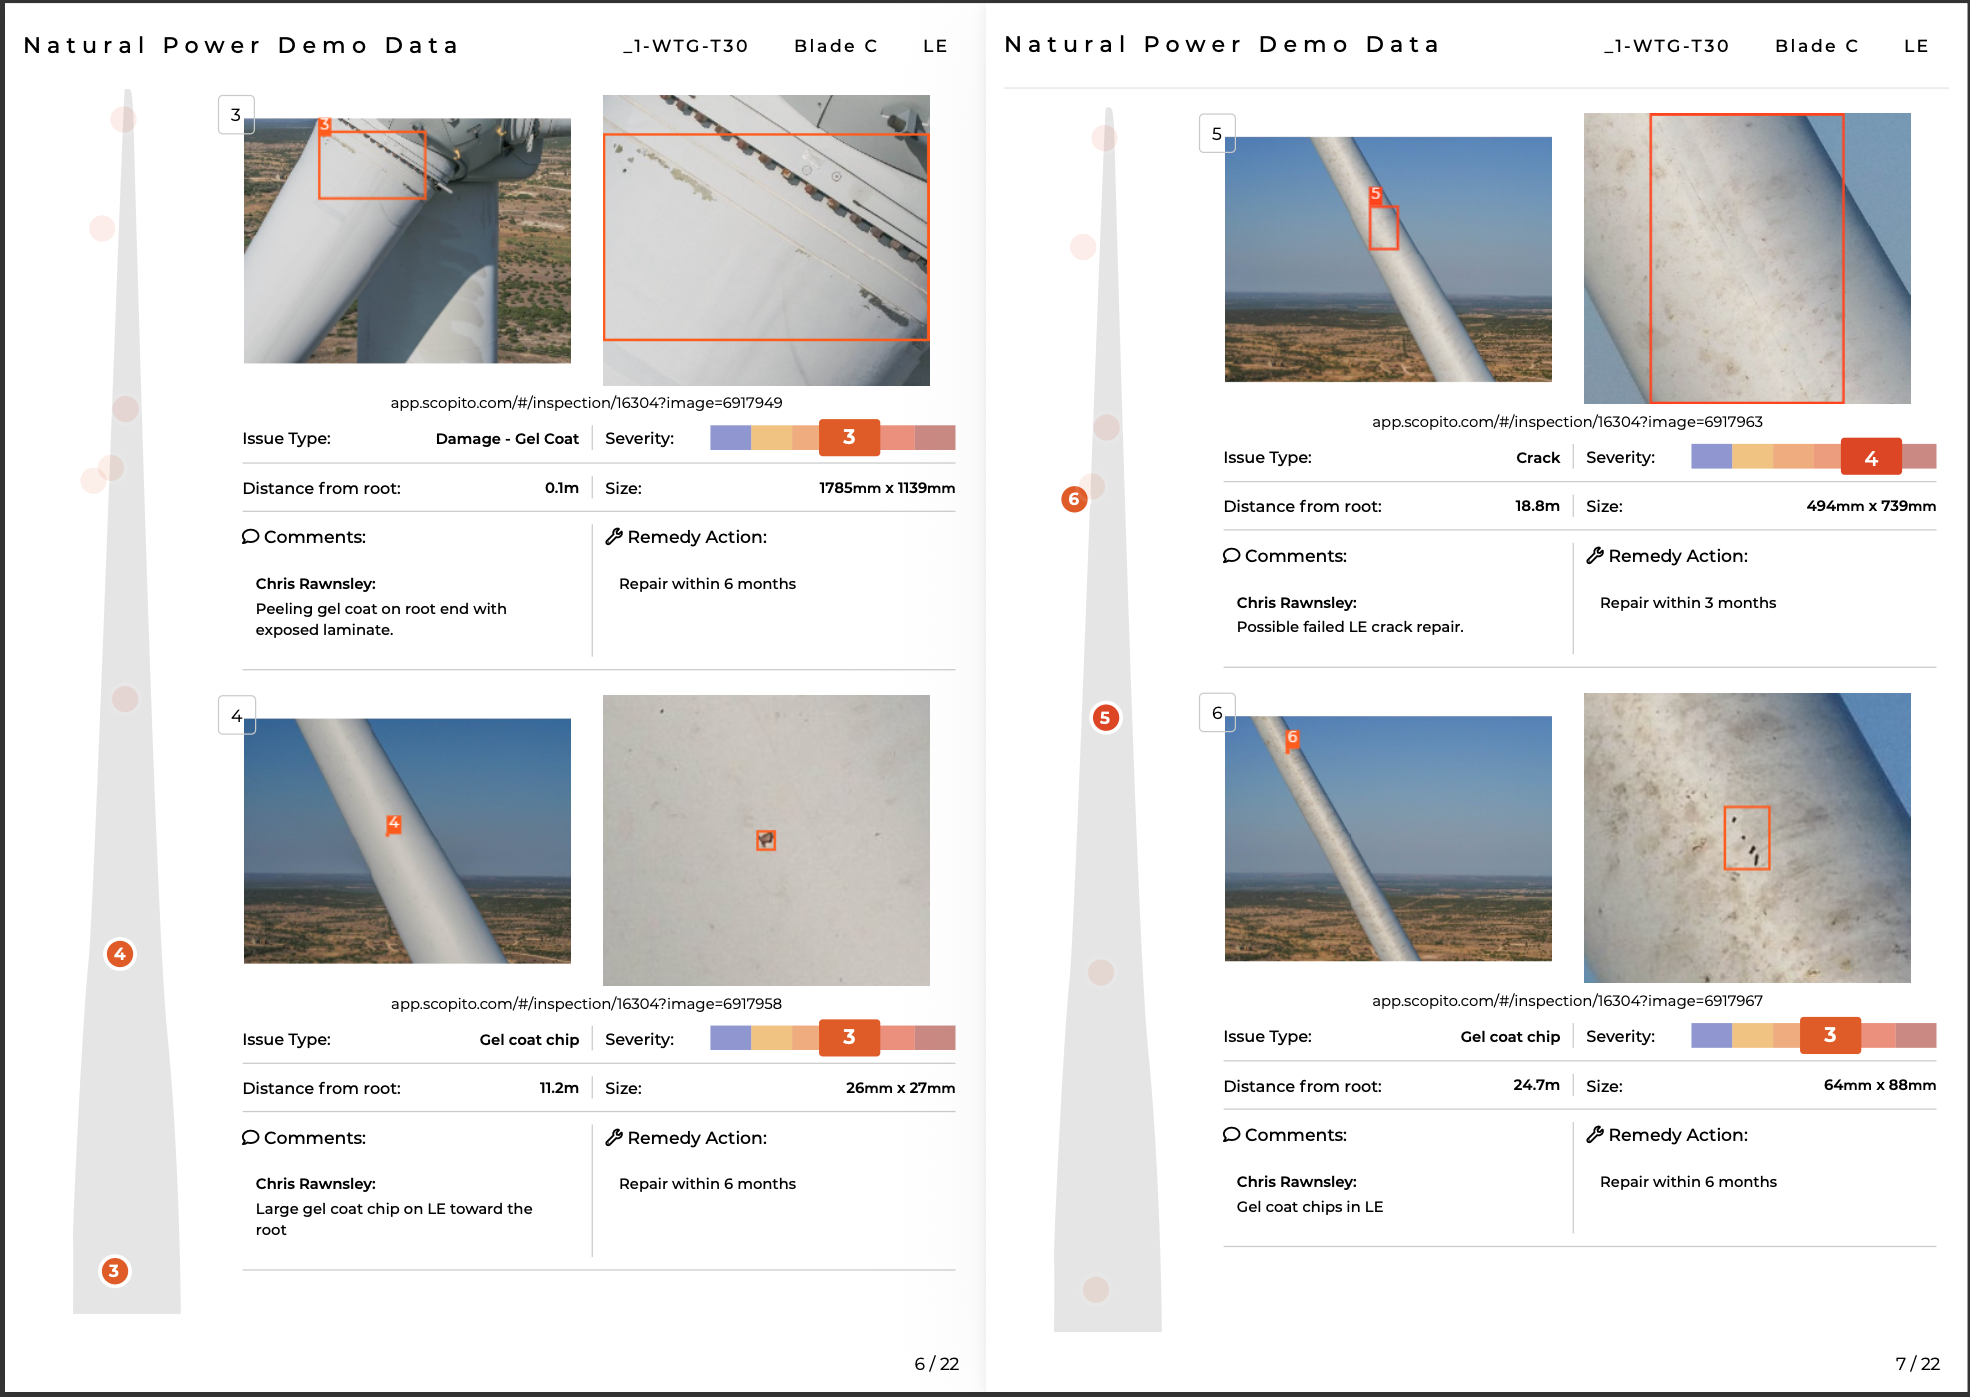 Sev 4 · Crack
Blade C leading-edge crack, graded and measured
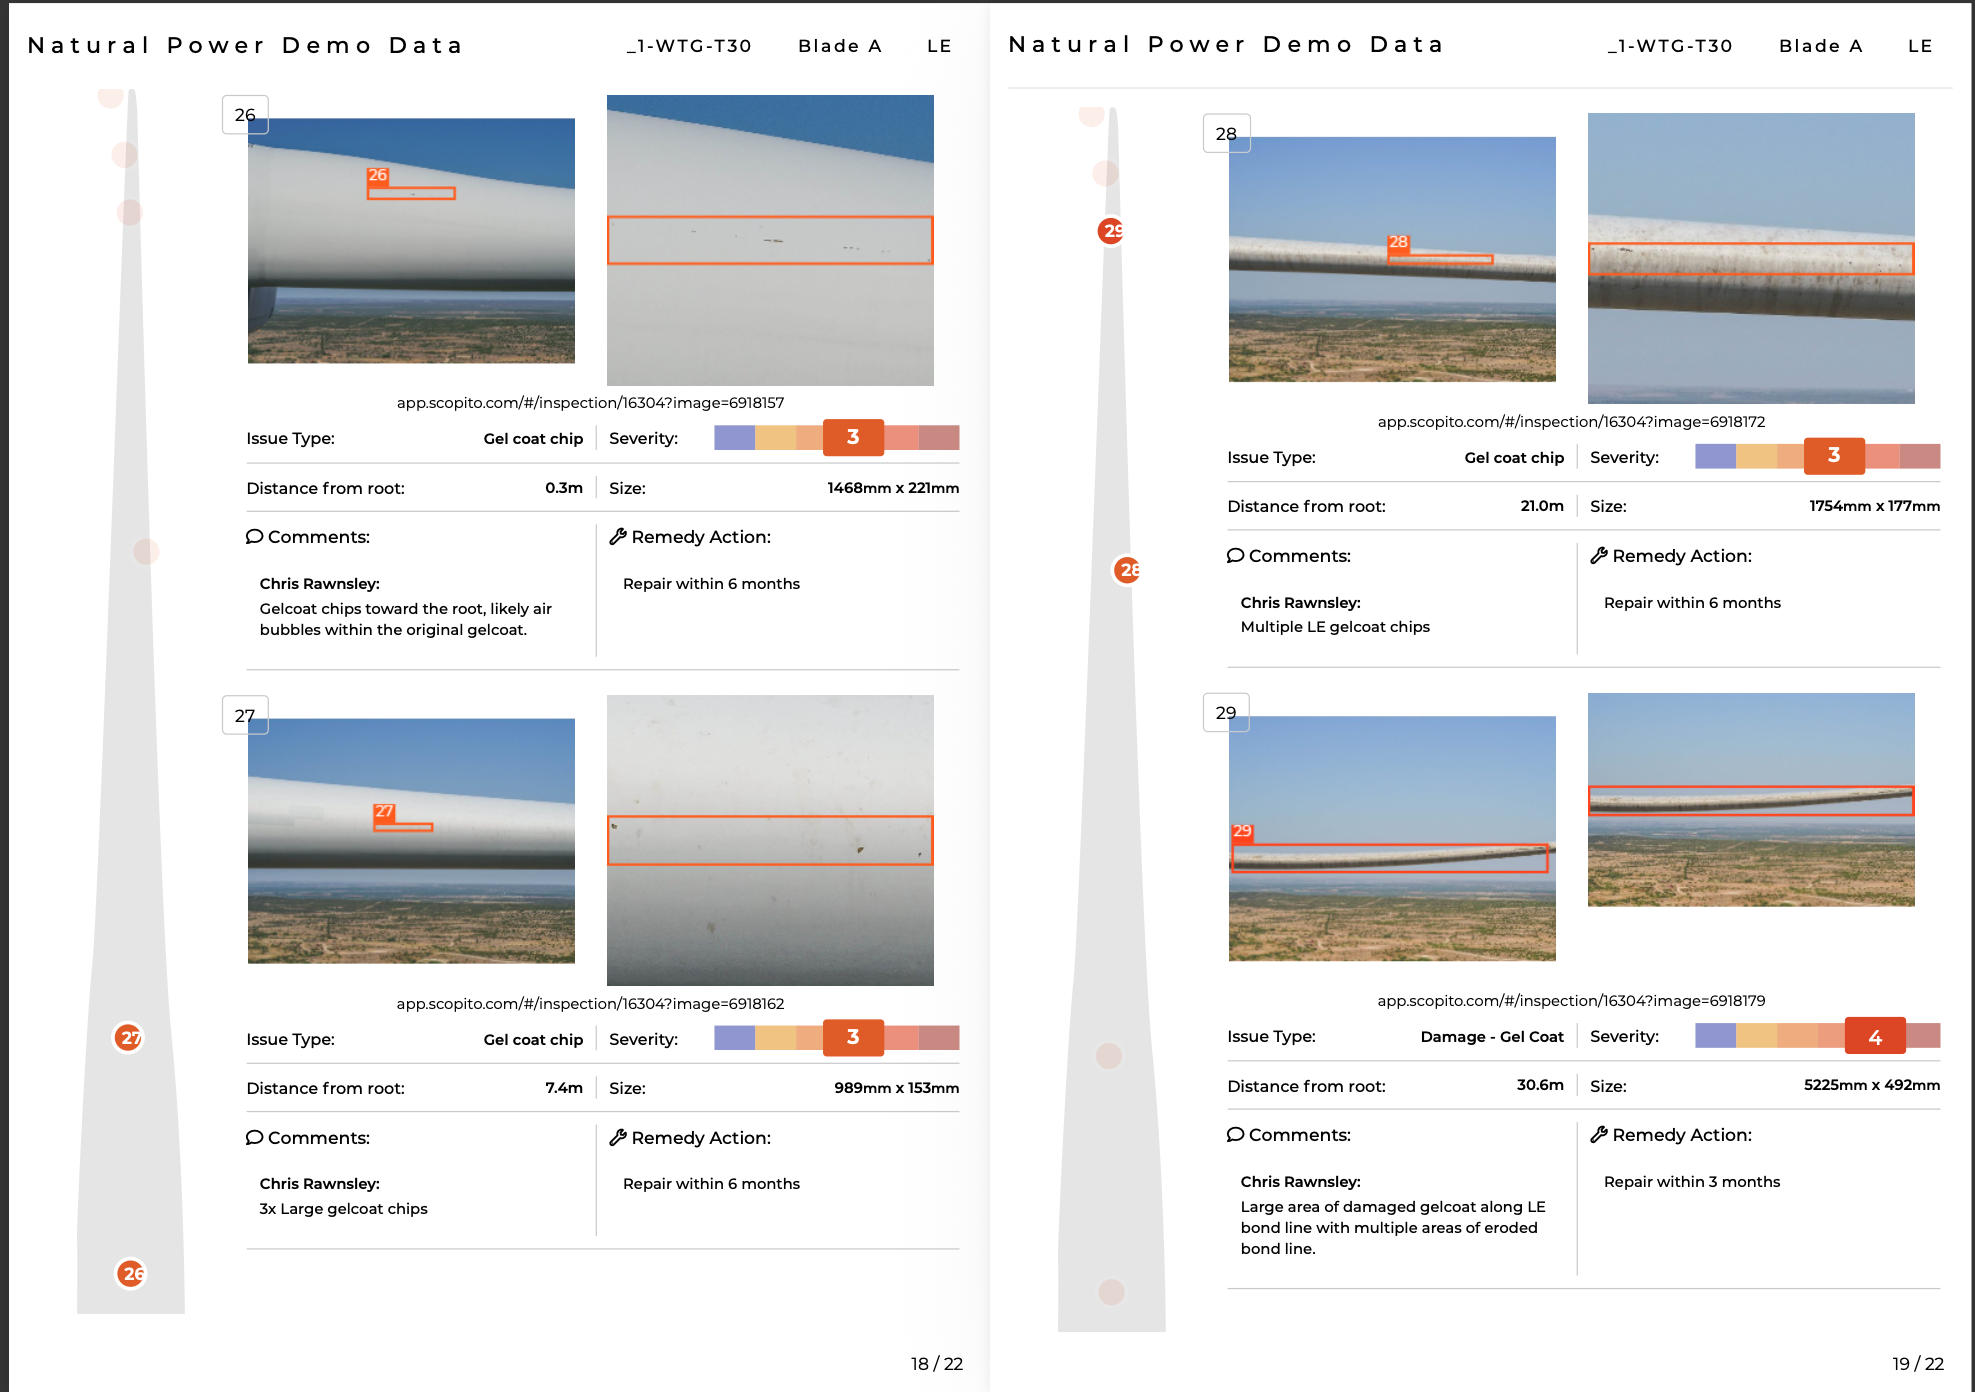 Sev 4 · Gel Coat
Blade A gel-coat damage along the bond line
Want a sample report for your fleet?
Blue UAS Cleared aircraft · American-made platform · mobile field deployment
Explore Other Industries MIR Serves
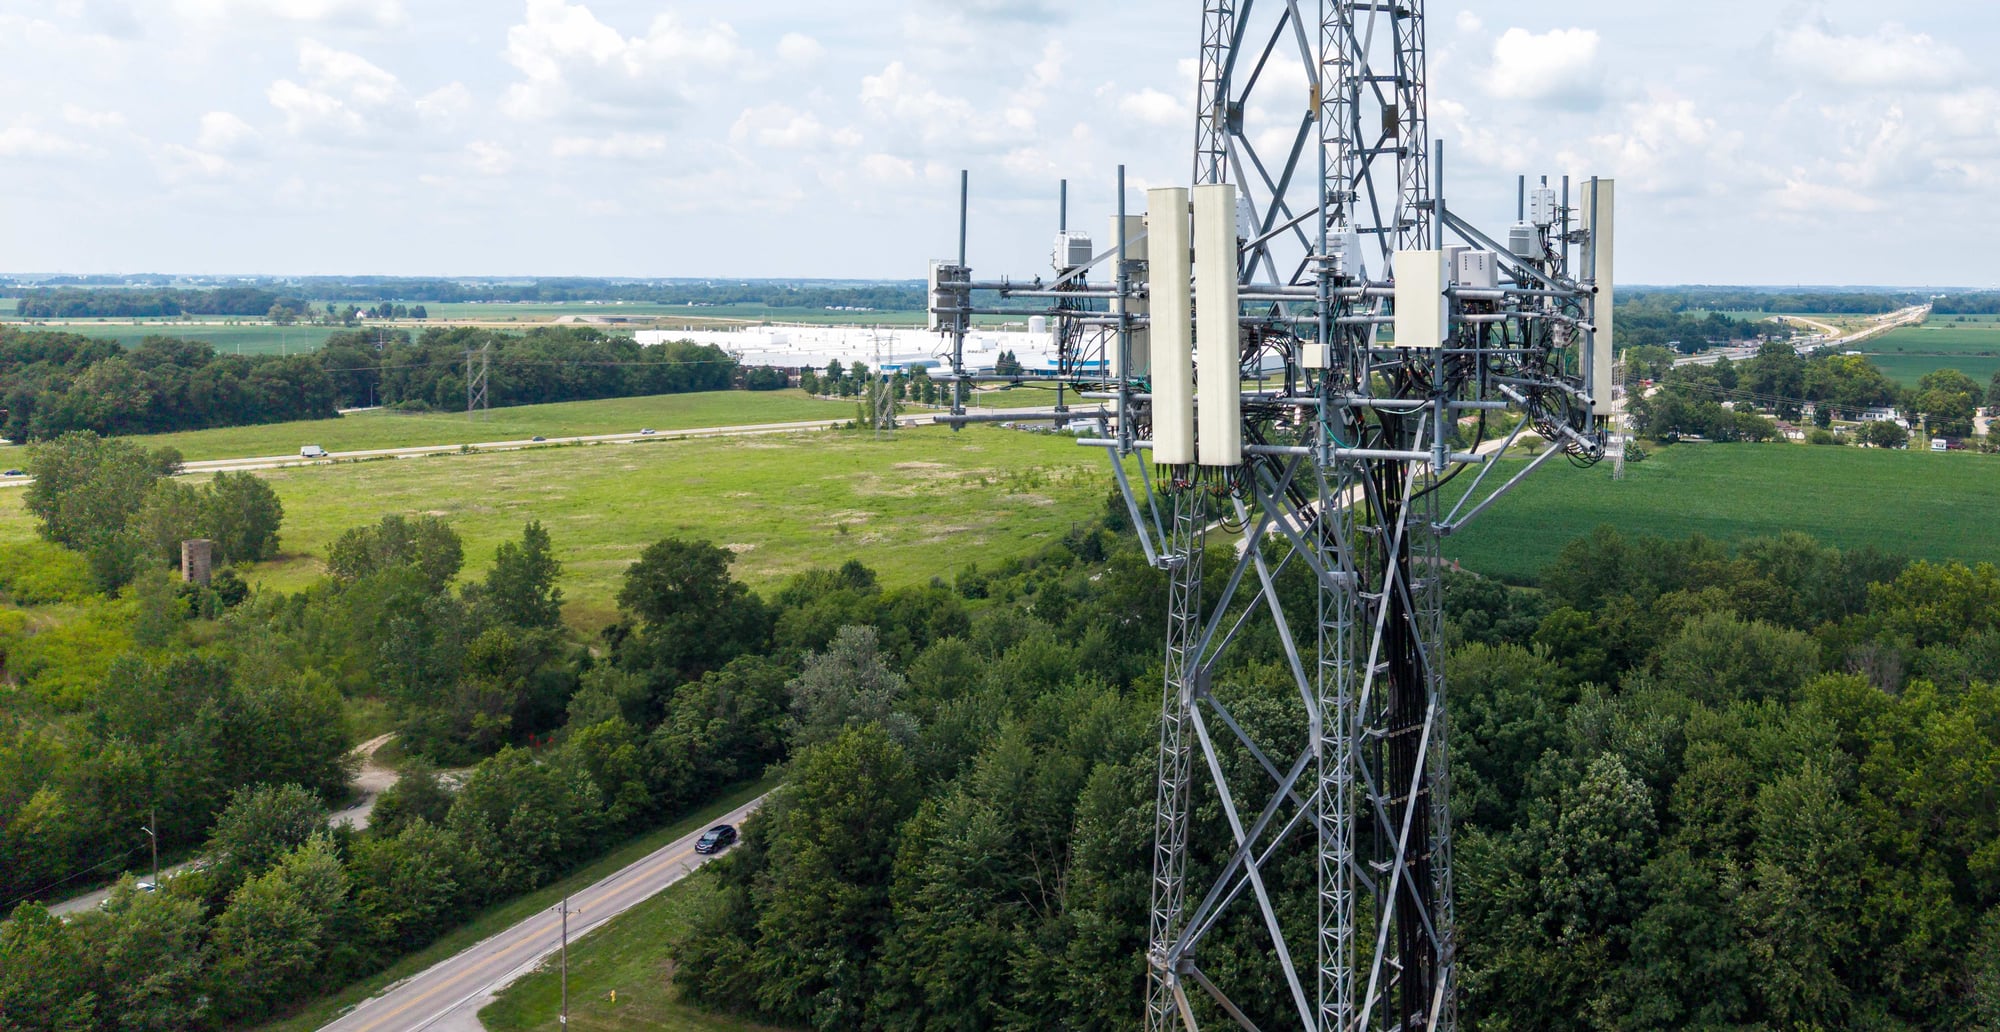
Telecom
Cell-site audits, structural documentation, and measurable digital twins that support colocation and close-out.
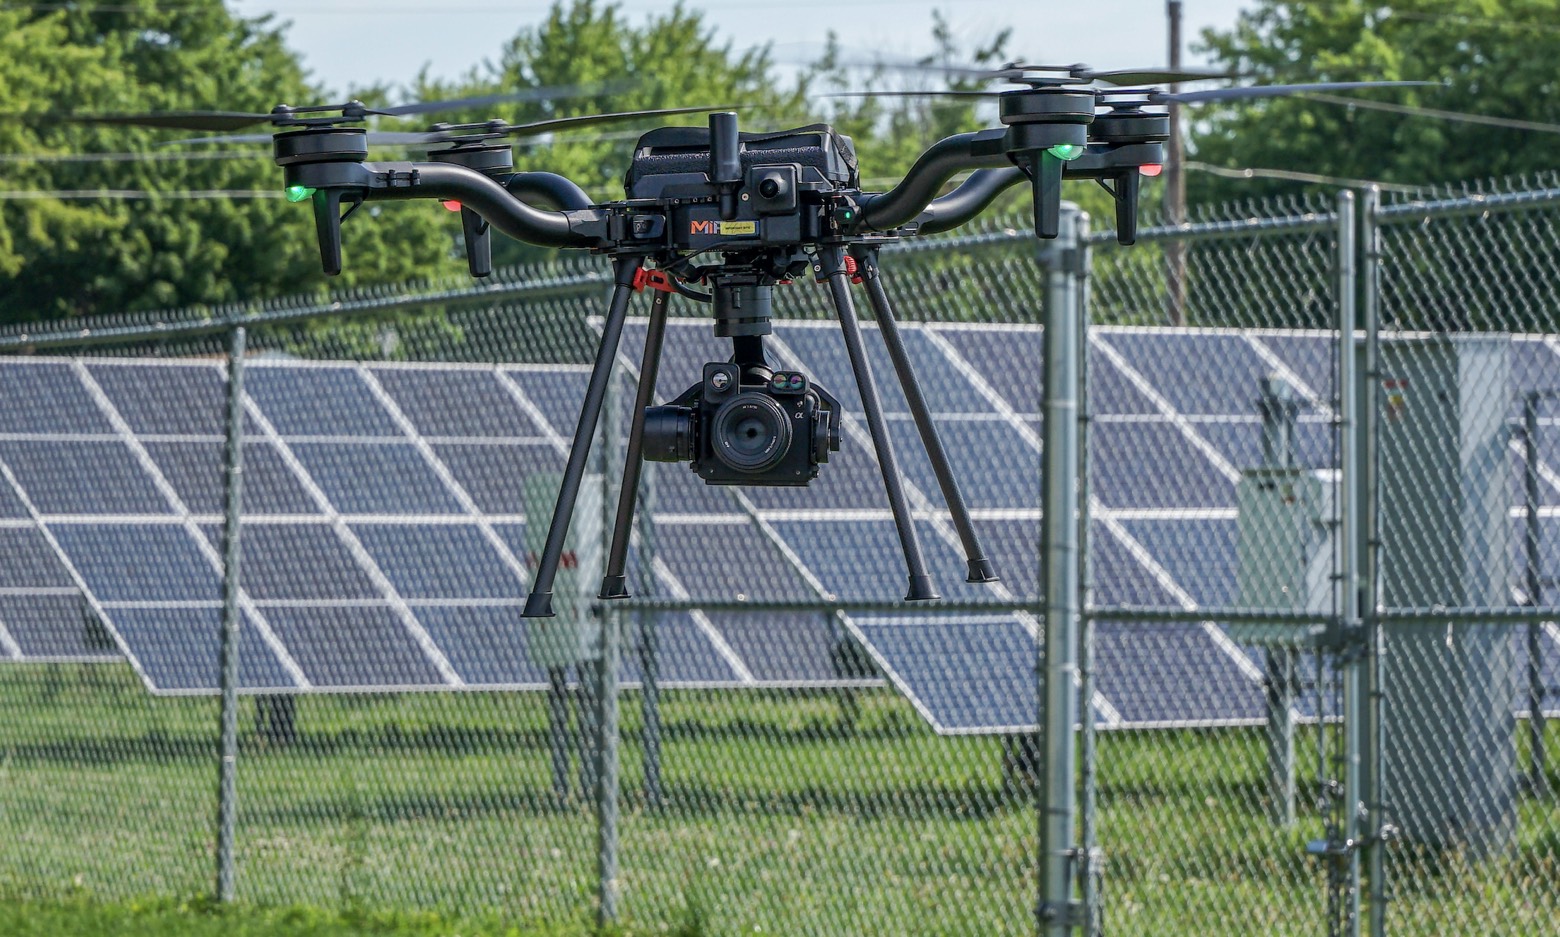
Solar & Renewables
Aerial thermography that locates hot spots, diode failures, and string outages down to the module.
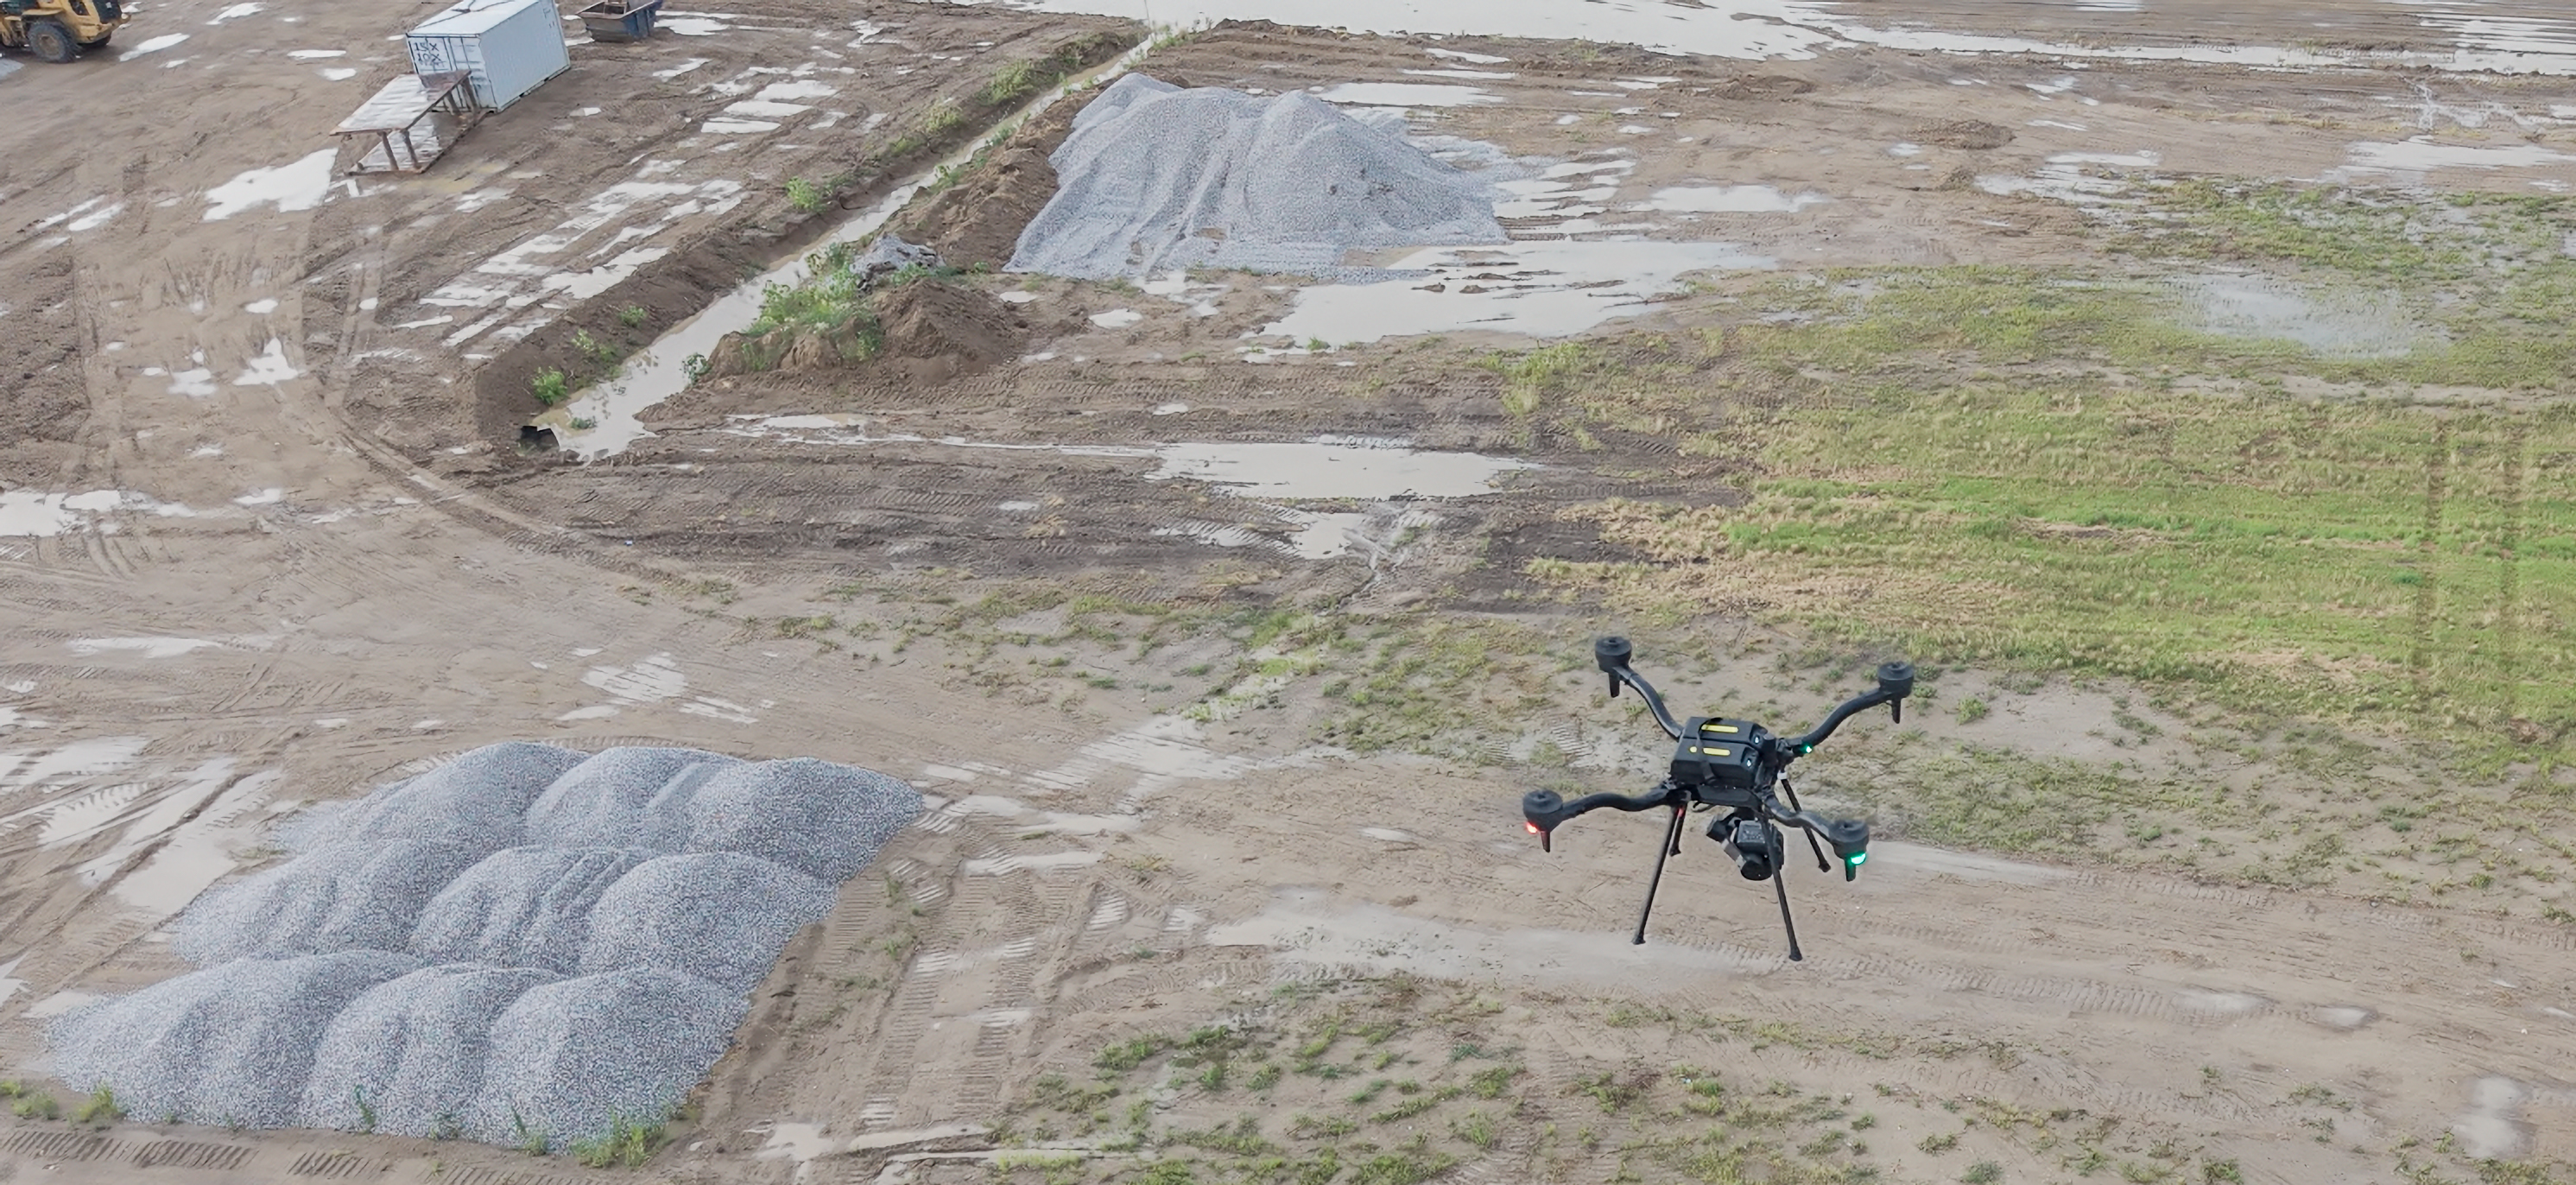
Mining & Aggregates
RTK-referenced stockpile volumetrics, pit-progression models, and highwall documentation — captured with high-accuracy photogrammetry and LiDAR, without entering hazardous zones.
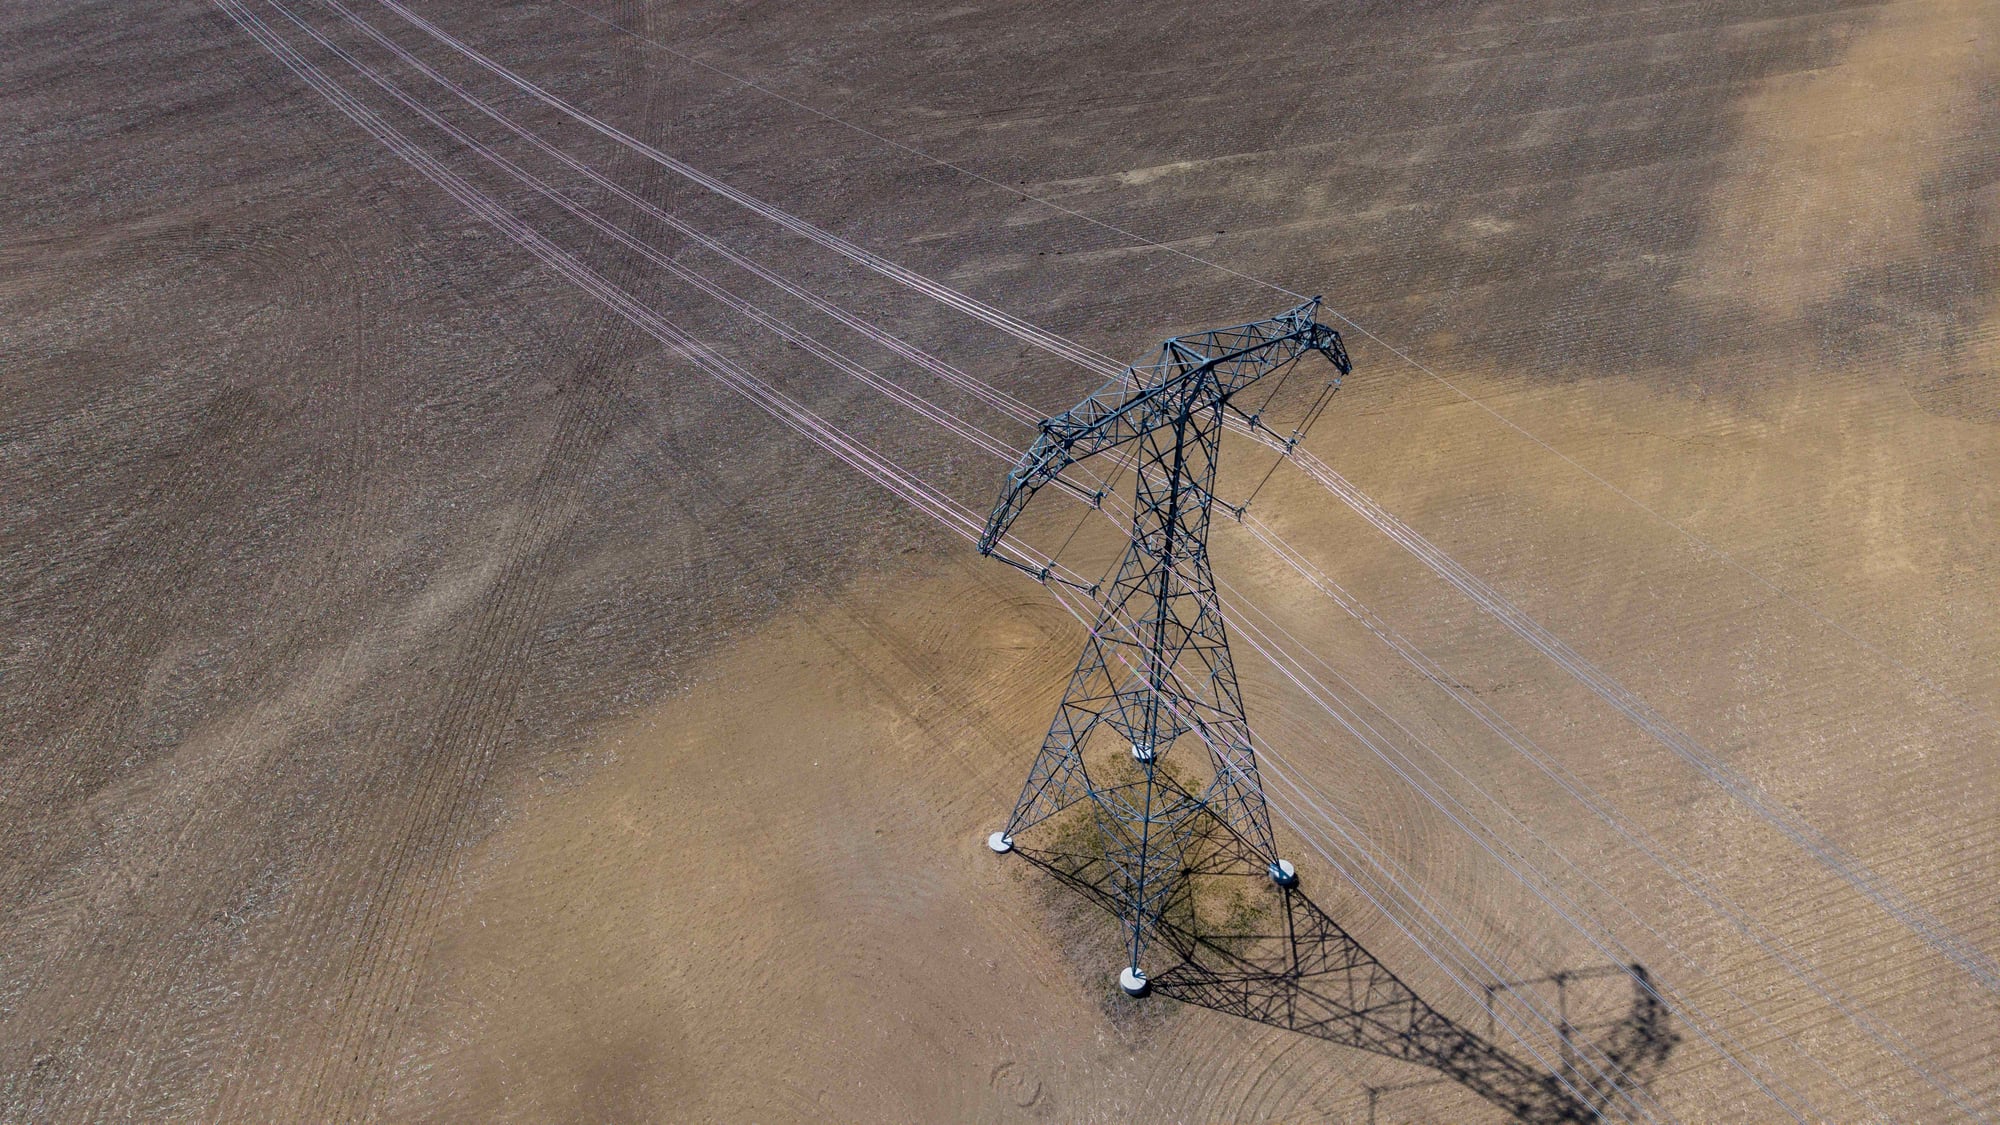
Utilities & ROW
T&D structure inspection, LiDAR corridor mapping, and vegetation-encroachment documentation for reliability and compliance.
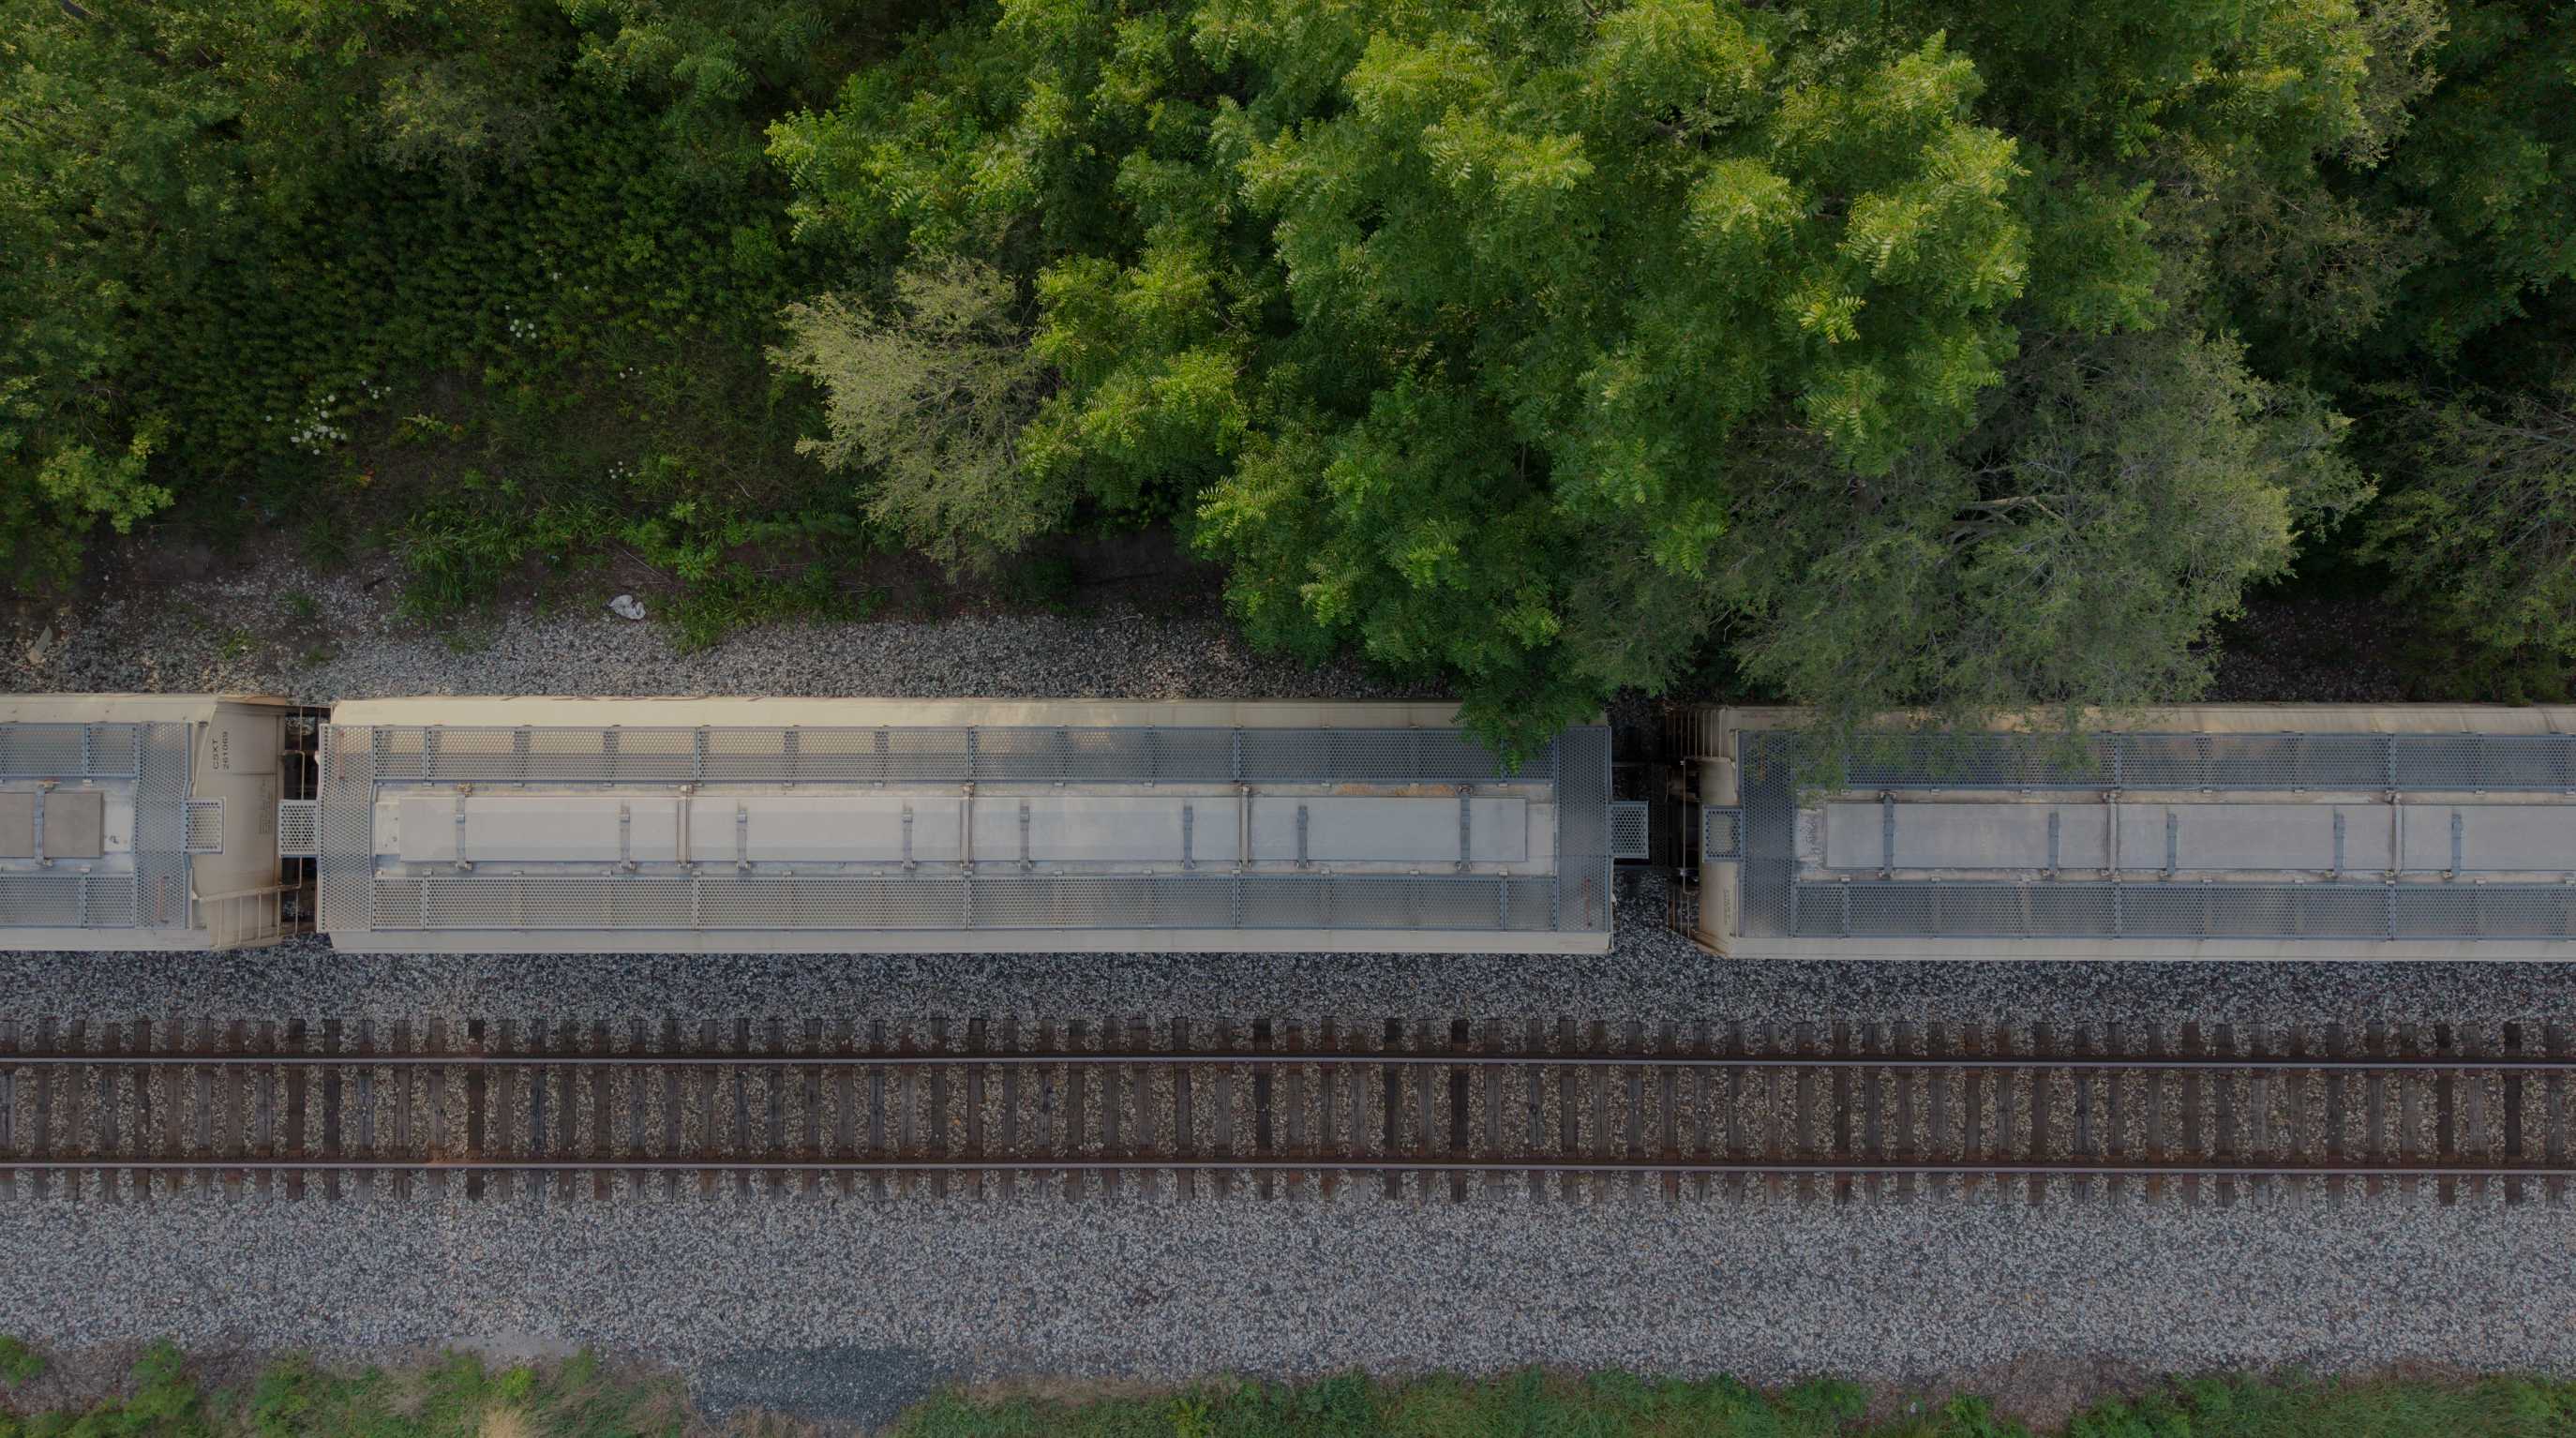
Rail & Transportation
RGB corridor mapping and LiDAR data along rail corridors — reducing time spent on or near live track.
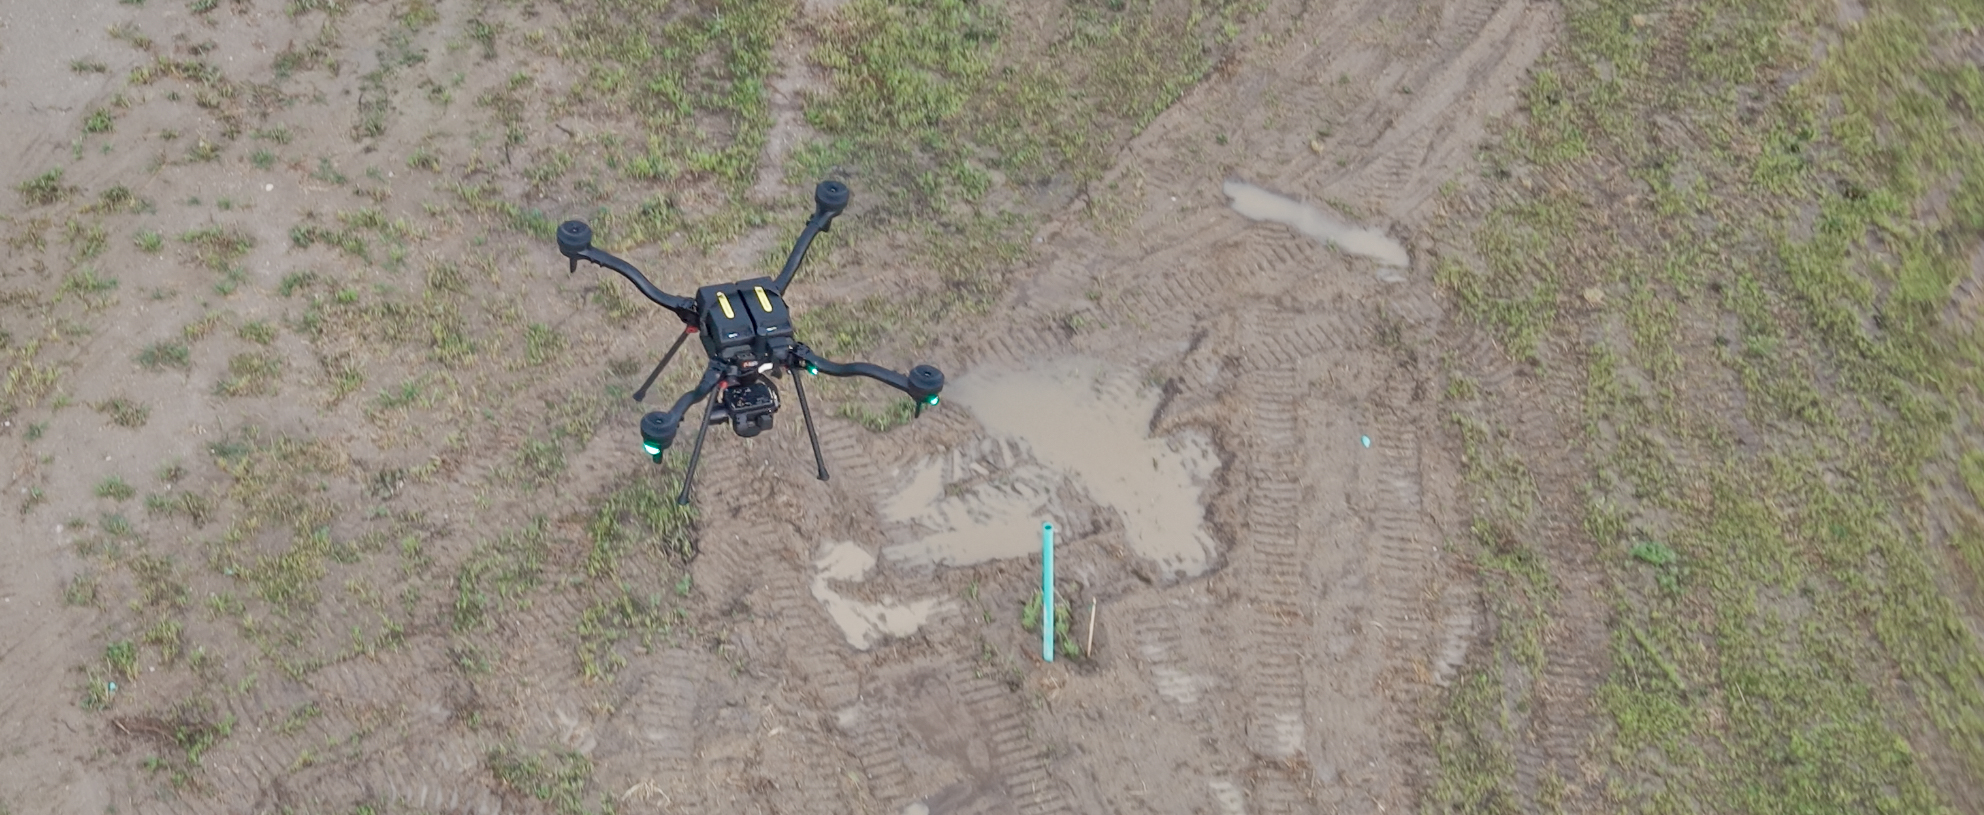
Civil & Geospatial Support
RTK-enabled aerial LiDAR and 61MP RGB collection — orthomosaics, point clouds, terrain surfaces, and construction documentation to support licensed survey teams, civil engineers, developers, and contractors.
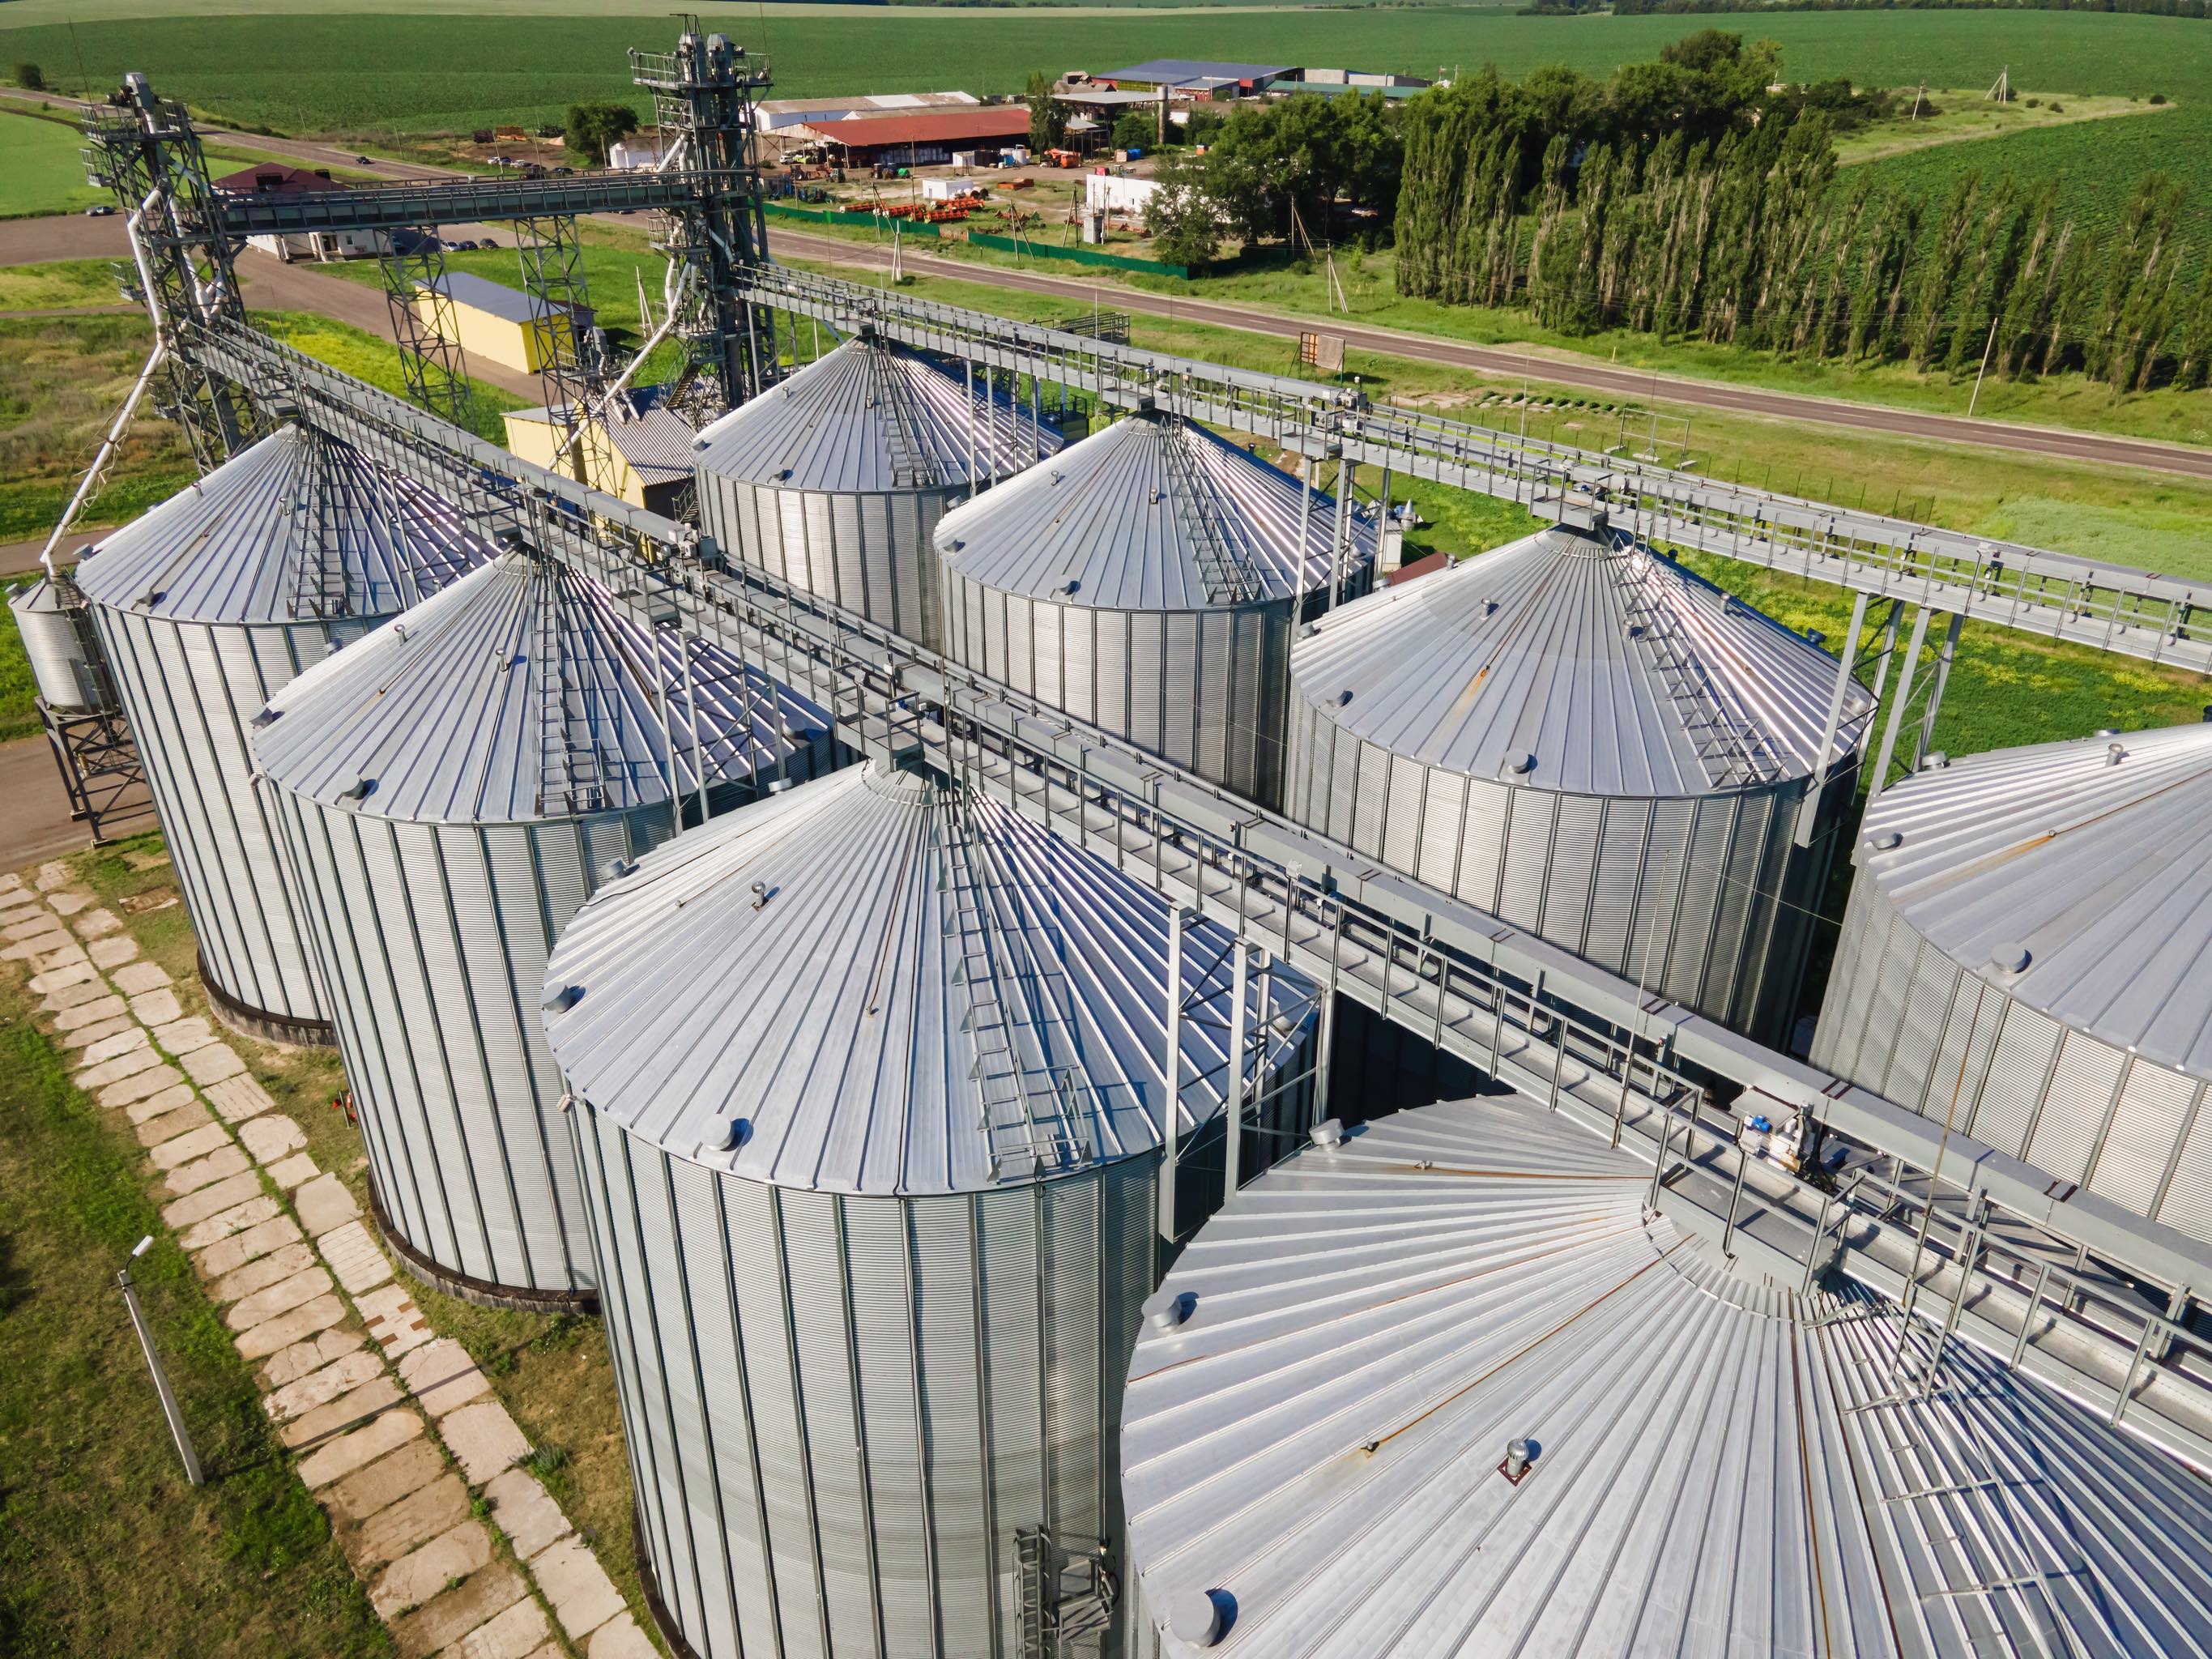
Grain Storage & Handling
Exterior condition documentation, thermal risk screening, and RTK-referenced quantity data for concrete silos, steel grain bins, elevator structures, handling equipment, and visible open storage.
Start With the Project Objective
Have a Wind Energy Project?
Tell us what needs to be inspected, mapped, measured, or documented. We'll help determine the right collection method, payload, mission structure, and deliverables.